| Red | Green | Blue | |
| z | 17.64 | ||
| znorm | Inf | ||
| sky | -Inf | -Inf | -Inf |
| S/N | 28.0 | 47.9 | 53.0 |
| S/N(c) | 0.0 | 0.0 | 0.0 |
| SN(E/C) |

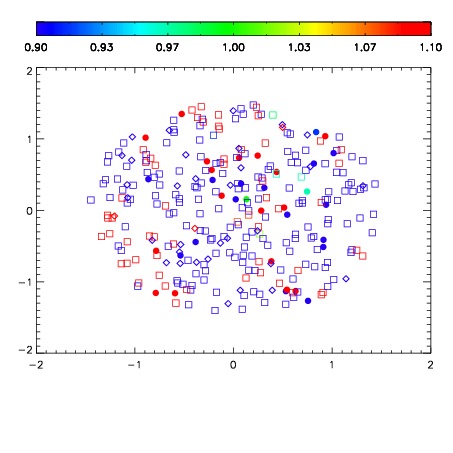
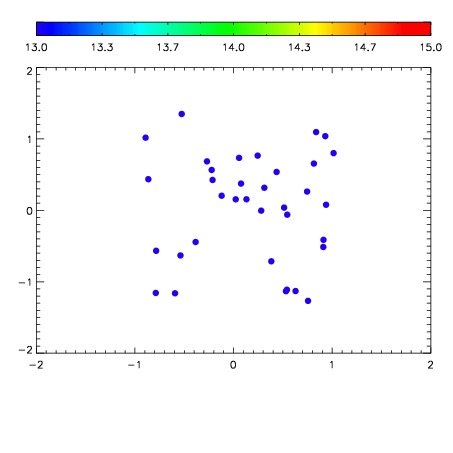

| Frame | Nreads | Zeropoints | Mag plots | Spatial mag deviation | Spatial sky 16325A emission deviations (filled: sky, open: star) | Spatial sky continuum emission | Spatial sky telluric CO2 absorption deviations (filled: H < 10) | |||||||||||||||||||||||
| 0 | 0 |
|
|
|
|
|
|
| IPAIR | NAME | SHIFT | NEWSHIFT | S/N | NAME | SHIFT | NEWSHIFT | S/N |
| 0 | 10200076 | 0.493672 | 0.00000 | 219.625 | 10200077 | 0.00101655 | 0.492655 | 225.022 |
| 1 | 10200071 | 0.492045 | 0.00162703 | 234.708 | 10200070 | 0.00000 | 0.493672 | 232.605 |
| 2 | 10200072 | 0.492216 | 0.00145602 | 233.619 | 10200074 | 0.00119050 | 0.492481 | 232.260 |
| 3 | 10200075 | 0.493032 | 0.000640005 | 230.378 | 10200073 | 0.00144627 | 0.492226 | 226.845 |