| Red | Green | Blue | |
| z | 17.64 | ||
| znorm | Inf | ||
| sky | -Inf | -Inf | -Inf |
| S/N | 29.3 | 47.6 | 53.9 |
| S/N(c) | 0.0 | 0.0 | 0.0 |
| SN(E/C) |
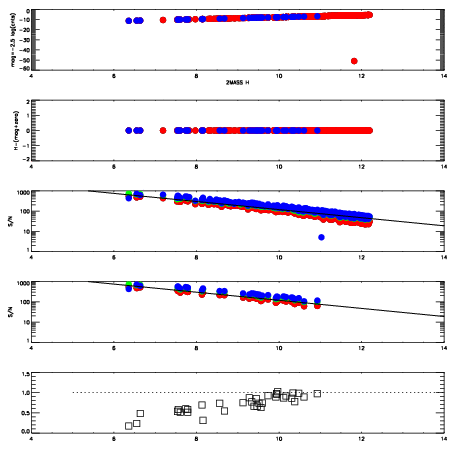
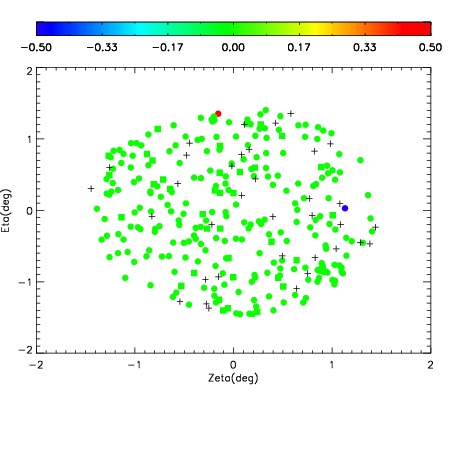
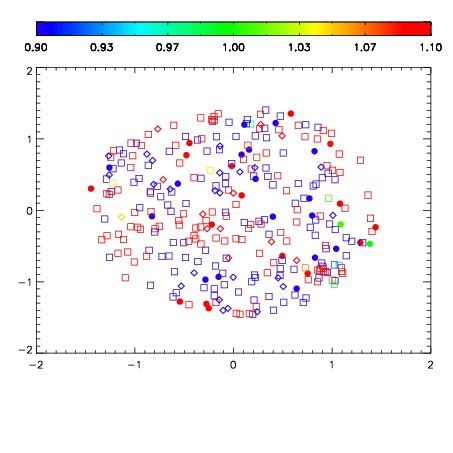
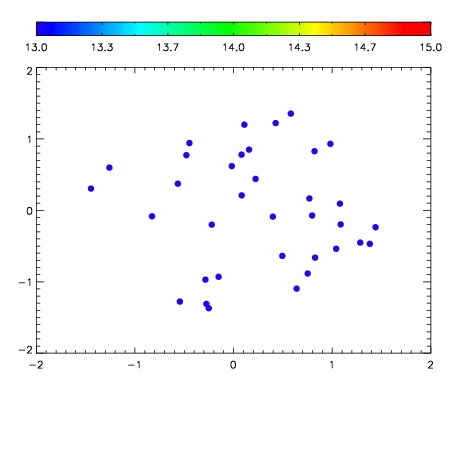

| Frame | Nreads | Zeropoints | Mag plots | Spatial mag deviation | Spatial sky 16325A emission deviations (filled: sky, open: star) | Spatial sky continuum emission | Spatial sky telluric CO2 absorption deviations (filled: H < 10) | |||||||||||||||||||||||
| 0 | 0 |
|
|
|
|
|
|
| IPAIR | NAME | SHIFT | NEWSHIFT | S/N | NAME | SHIFT | NEWSHIFT | S/N |
| 0 | 03670014 | 0.504722 | 0.00000 | 196.375 | 03670015 | 0.00360209 | 0.501120 | 199.843 |
| 1 | 03670013 | 0.500807 | 0.00391501 | 192.486 | 03670012 | 0.00111214 | 0.503610 | 190.712 |
| 2 | 03670010 | 0.502884 | 0.00183803 | 190.976 | 03670008 | 0.00000 | 0.504722 | 188.001 |
| 3 | 03670009 | 0.501324 | 0.00339800 | 185.694 | 03670011 | 0.00147330 | 0.503249 | 185.446 |