| Red | Green | Blue | |
| z | 17.64 | ||
| znorm | Inf | ||
| sky | -Inf | -Inf | -Inf |
| S/N | 29.9 | 49.7 | 55.4 |
| S/N(c) | 0.0 | 0.0 | 0.0 |
| SN(E/C) |
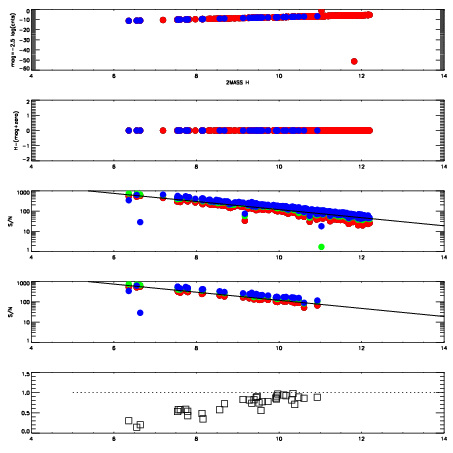

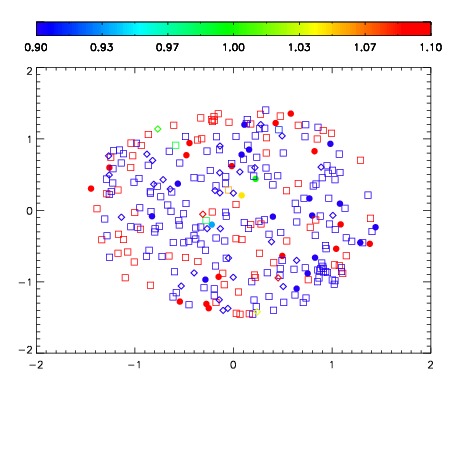
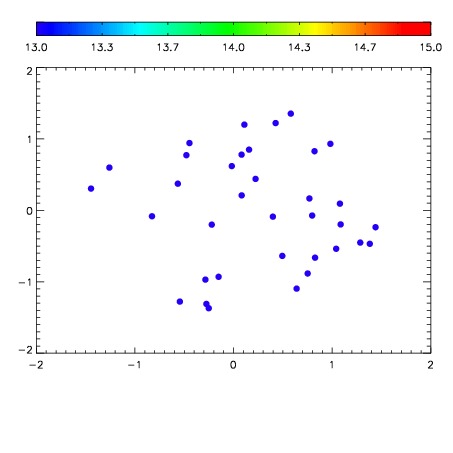

| Frame | Nreads | Zeropoints | Mag plots | Spatial mag deviation | Spatial sky 16325A emission deviations (filled: sky, open: star) | Spatial sky continuum emission | Spatial sky telluric CO2 absorption deviations (filled: H < 10) | |||||||||||||||||||||||
| 0 | 0 |
|
|
|
|
|
|
| IPAIR | NAME | SHIFT | NEWSHIFT | S/N | NAME | SHIFT | NEWSHIFT | S/N |
| 0 | 10450060 | 0.504780 | 0.00000 | 192.324 | 10450058 | 0.00000 | 0.504780 | 188.394 |
| 1 | 10450064 | 0.504590 | 0.000190020 | 196.767 | 10450061 | 0.00260955 | 0.502170 | 194.903 |
| 2 | 10450063 | 0.503389 | 0.00139099 | 196.214 | 10450062 | 0.00244167 | 0.502338 | 194.897 |
| 3 | 10450059 | 0.504442 | 0.000338018 | 193.761 | 10450065 | 0.00354574 | 0.501234 | 194.024 |