| Red | Green | Blue | |
| z | 17.64 | ||
| znorm | Inf | ||
| sky | -Inf | -Inf | -Inf |
| S/N | 21.3 | 34.5 | 36.9 |
| S/N(c) | 0.0 | 0.0 | 0.0 |
| SN(E/C) |

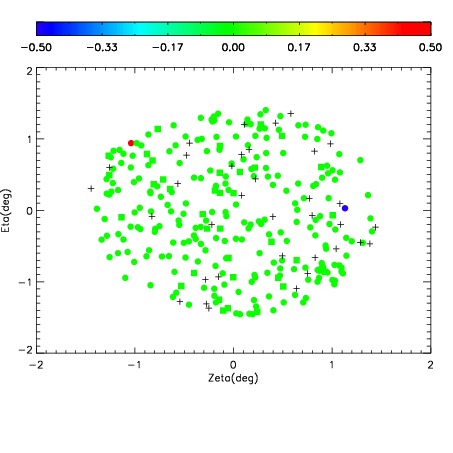

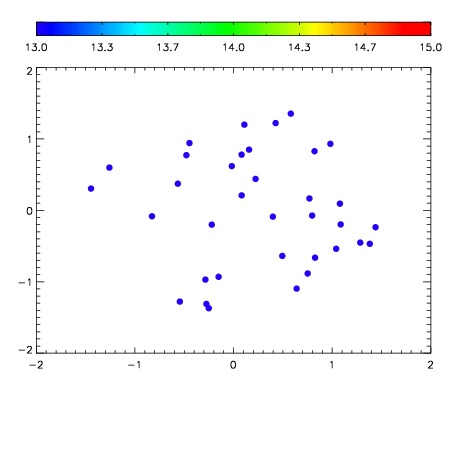

| Frame | Nreads | Zeropoints | Mag plots | Spatial mag deviation | Spatial sky 16325A emission deviations (filled: sky, open: star) | Spatial sky continuum emission | Spatial sky telluric CO2 absorption deviations (filled: H < 10) | |||||||||||||||||||||||
| 0 | 0 |
|
|
|
|
|
|
| IPAIR | NAME | SHIFT | NEWSHIFT | S/N | NAME | SHIFT | NEWSHIFT | S/N |
| 0 | 10530027 | 0.494771 | 0.00000 | 133.587 | 10530025 | 0.00000 | 0.494771 | 173.427 |
| 1 | 10530026 | 0.492263 | 0.00250801 | 162.970 | 10530028 | -0.00616278 | 0.500934 | 176.994 |
| 2 | 10530030 | 0.494613 | 0.000158012 | 155.608 | 10530029 | -0.00663291 | 0.501404 | 176.547 |