| Red | Green | Blue | |
| z | 17.64 | ||
| znorm | Inf | ||
| sky | -Inf | -Inf | -Inf |
| S/N | 23.1 | 39.9 | 44.3 |
| S/N(c) | 0.0 | 0.0 | 0.0 |
| SN(E/C) |
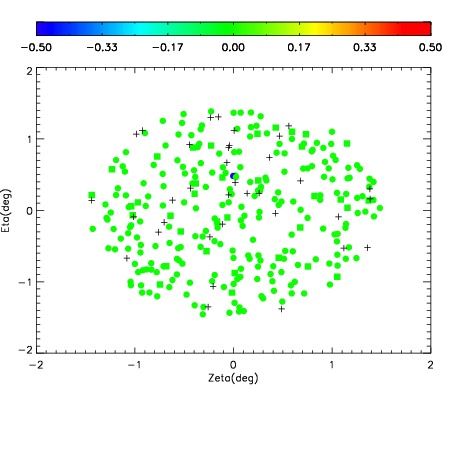
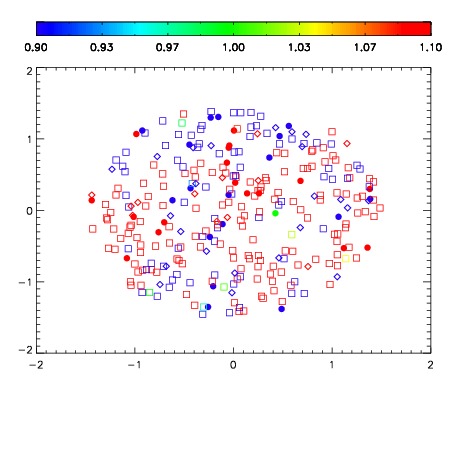
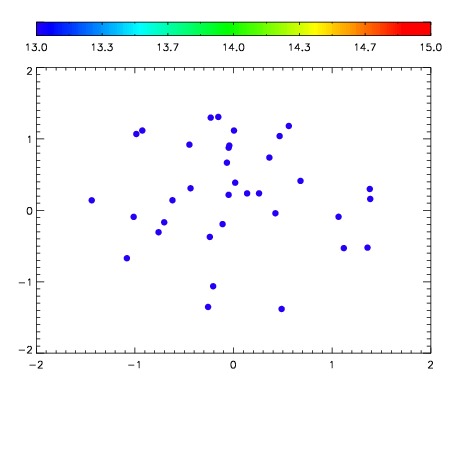

| Frame | Nreads | Zeropoints | Mag plots | Spatial mag deviation | Spatial sky 16325A emission deviations (filled: sky, open: star) | Spatial sky continuum emission | Spatial sky telluric CO2 absorption deviations (filled: H < 10) | |||||||||||||||||||||||
| 0 | 0 |
|
|
|
|
|
|
| IPAIR | NAME | SHIFT | NEWSHIFT | S/N | NAME | SHIFT | NEWSHIFT | S/N |
| 0 | 03750016 | 0.499417 | 0.00000 | 150.301 | 03750017 | 0.00216509 | 0.497252 | 175.423 |
| 1 | 03750019 | 0.496129 | 0.00328800 | 188.969 | 03750013 | 0.00174510 | 0.497672 | 191.643 |
| 2 | 03750012 | 0.495048 | 0.00436902 | 186.924 | 03750010 | 0.00000 | 0.499417 | 186.368 |
| 3 | 03750020 | 0.497614 | 0.00180301 | 186.349 | 03750021 | -0.00236671 | 0.501784 | 184.073 |
| 4 | 03750015 | 0.494238 | 0.00517902 | 172.860 | 03750018 | -0.00182222 | 0.501239 | 182.520 |
| 5 | 03750011 | 0.491931 | 0.00748602 | 167.243 | 03750014 | 0.000614743 | 0.498802 | 181.765 |