| Red | Green | Blue | |
| z | 17.64 | ||
| znorm | Inf | ||
| sky | -Inf | -Inf | -Inf |
| S/N | 27.6 | 44.7 | 48.5 |
| S/N(c) | 0.0 | 0.0 | 0.0 |
| SN(E/C) |


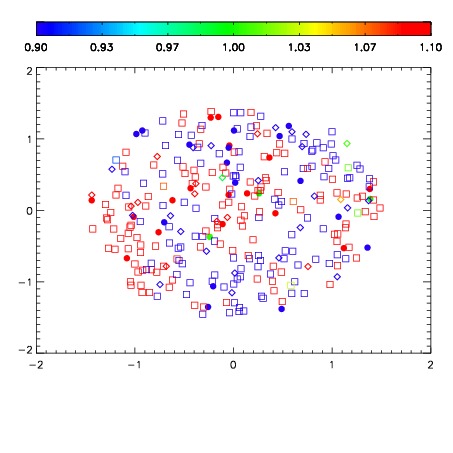
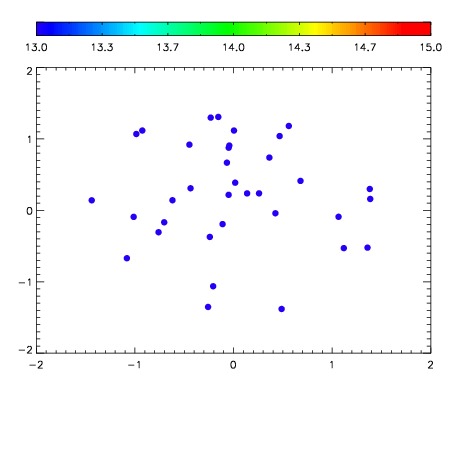

| Frame | Nreads | Zeropoints | Mag plots | Spatial mag deviation | Spatial sky 16325A emission deviations (filled: sky, open: star) | Spatial sky continuum emission | Spatial sky telluric CO2 absorption deviations (filled: H < 10) | |||||||||||||||||||||||
| 0 | 0 |
|
|
|
|
|
|
| IPAIR | NAME | SHIFT | NEWSHIFT | S/N | NAME | SHIFT | NEWSHIFT | S/N |
| 0 | 07530013 | 0.474416 | 0.00000 | 205.287 | 07530011 | 0.00000 | 0.474416 | 207.383 |
| 1 | 07530016 | 0.473073 | 0.00134298 | 212.376 | 07530015 | 0.000632295 | 0.473784 | 209.584 |
| 2 | 07530012 | 0.473592 | 0.000823975 | 210.480 | 07530018 | 0.00196876 | 0.472447 | 207.880 |
| 3 | 07530017 | 0.473883 | 0.000532985 | 208.300 | 07530014 | 0.00179848 | 0.472618 | 207.417 |