| Red | Green | Blue | |
| z | 17.64 | ||
| znorm | Inf | ||
| sky | -Inf | -Inf | -Inf |
| S/N | 32.7 | 56.0 | 59.9 |
| S/N(c) | 0.0 | 0.0 | 0.0 |
| SN(E/C) |
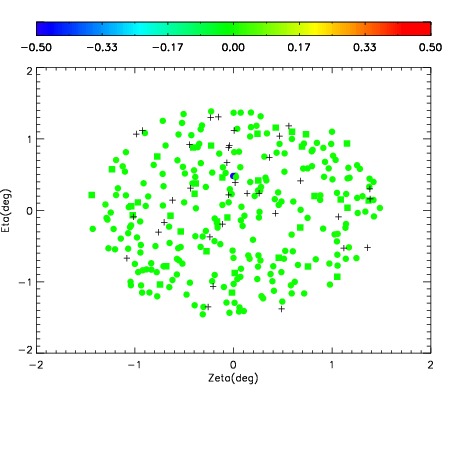
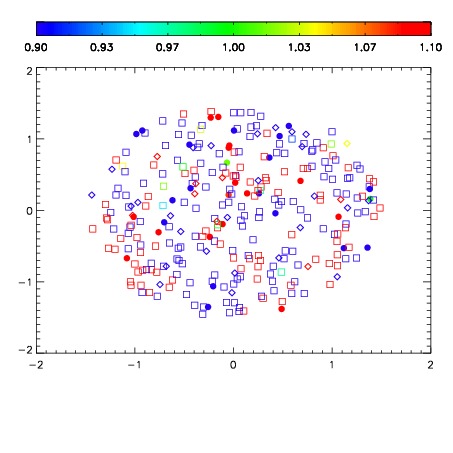
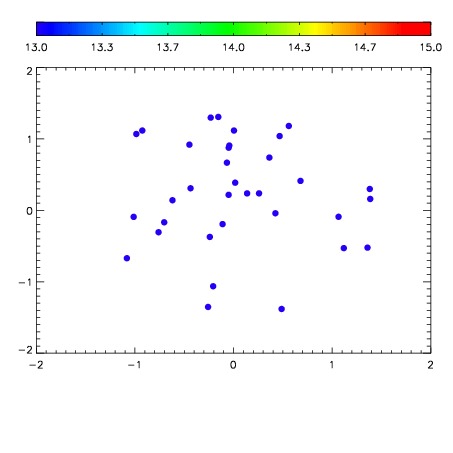

| Frame | Nreads | Zeropoints | Mag plots | Spatial mag deviation | Spatial sky 16325A emission deviations (filled: sky, open: star) | Spatial sky continuum emission | Spatial sky telluric CO2 absorption deviations (filled: H < 10) | |||||||||||||||||||||||
| 0 | 0 |
|
|
|
|
|
|
| IPAIR | NAME | SHIFT | NEWSHIFT | S/N | NAME | SHIFT | NEWSHIFT | S/N |
| 0 | 10210081 | 0.493145 | 0.00000 | 212.634 | 10210080 | 0.00286901 | 0.490276 | 213.869 |
| 1 | 10210073 | 0.491615 | 0.00152999 | 221.713 | 10210076 | 0.00401201 | 0.489133 | 217.215 |
| 2 | 10210074 | 0.491211 | 0.00193399 | 220.764 | 10210075 | 0.00384476 | 0.489300 | 216.444 |
| 3 | 10210077 | 0.491793 | 0.00135198 | 215.883 | 10210072 | 0.00000 | 0.493145 | 215.004 |
| 4 | 10210078 | 0.492405 | 0.000739992 | 213.898 | 10210079 | 0.00328104 | 0.489864 | 214.446 |