| Red | Green | Blue | |
| z | 17.64 | ||
| znorm | Inf | ||
| sky | -Inf | -Inf | -Inf |
| S/N | 27.1 | 46.5 | 50.0 |
| S/N(c) | 0.0 | 0.0 | 0.0 |
| SN(E/C) |

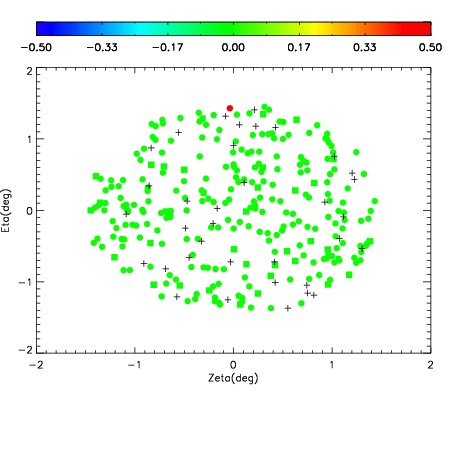
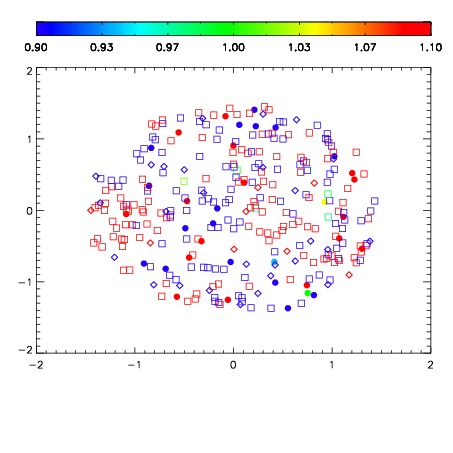
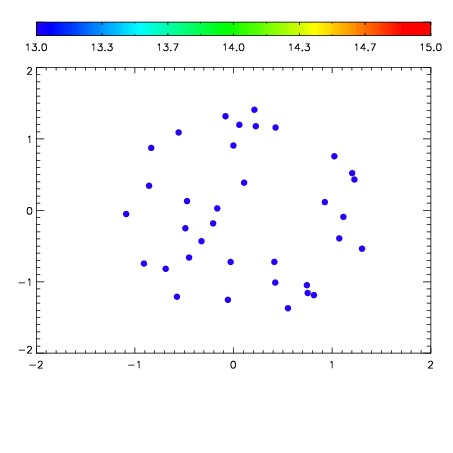

| Frame | Nreads | Zeropoints | Mag plots | Spatial mag deviation | Spatial sky 16325A emission deviations (filled: sky, open: star) | Spatial sky continuum emission | Spatial sky telluric CO2 absorption deviations (filled: H < 10) | |||||||||||||||||||||||
| 0 | 0 |
|
|
|
|
|
|
| IPAIR | NAME | SHIFT | NEWSHIFT | S/N | NAME | SHIFT | NEWSHIFT | S/N |
| 0 | 03660010 | 0.508721 | 0.00000 | 207.981 | 03660012 | -0.00101641 | 0.509737 | 207.927 |
| 1 | 03660014 | 0.502888 | 0.00583297 | 208.533 | 03660015 | 0.00158131 | 0.507140 | 213.553 |
| 2 | 03660013 | 0.499383 | 0.00933799 | 207.522 | 03660011 | 0.00173947 | 0.506982 | 206.245 |
| 3 | 03660009 | 0.504607 | 0.00411397 | 205.811 | 03660008 | 0.00000 | 0.508721 | 196.612 |