| Red | Green | Blue | |
| z | 17.64 | ||
| znorm | Inf | ||
| sky | -Inf | -Inf | -Inf |
| S/N | 29.1 | 48.4 | 53.9 |
| S/N(c) | 0.0 | 0.0 | 0.0 |
| SN(E/C) |
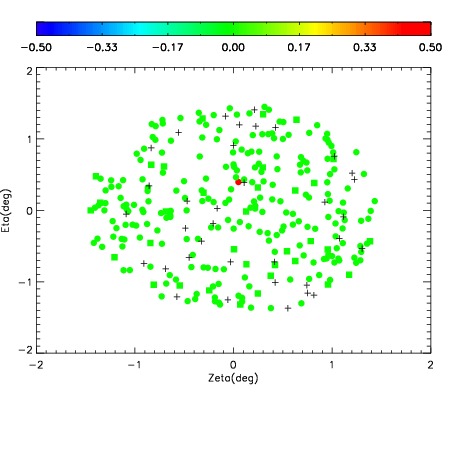
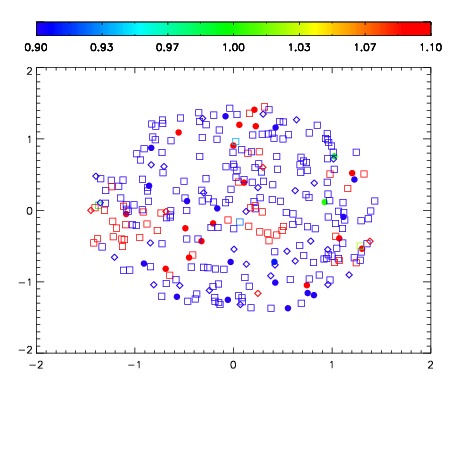
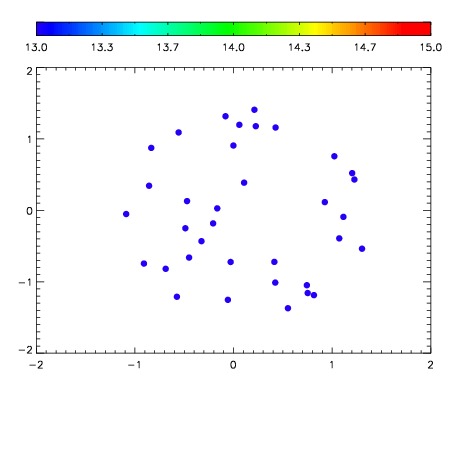

| Frame | Nreads | Zeropoints | Mag plots | Spatial mag deviation | Spatial sky 16325A emission deviations (filled: sky, open: star) | Spatial sky continuum emission | Spatial sky telluric CO2 absorption deviations (filled: H < 10) | |||||||||||||||||||||||
| 0 | 0 |
|
|
|
|
|
|
| IPAIR | NAME | SHIFT | NEWSHIFT | S/N | NAME | SHIFT | NEWSHIFT | S/N |
| 0 | 06930053 | 0.489160 | 0.00000 | 203.317 | 06930055 | -0.00130440 | 0.490464 | 201.854 |
| 1 | 06930056 | 0.487120 | 0.00204000 | 211.310 | 06930051 | 0.00000 | 0.489160 | 210.950 |
| 2 | 06930052 | 0.487496 | 0.00166401 | 207.755 | 06930058 | -0.00433628 | 0.493496 | 209.862 |
| 3 | 06930057 | 0.486480 | 0.00268000 | 204.197 | 06930054 | 0.00257875 | 0.486581 | 206.666 |