| Red | Green | Blue | |
| z | 17.64 | ||
| znorm | Inf | ||
| sky | -Inf | -Inf | -Inf |
| S/N | 27.5 | 44.3 | 48.3 |
| S/N(c) | 0.0 | 0.0 | 0.0 |
| SN(E/C) |
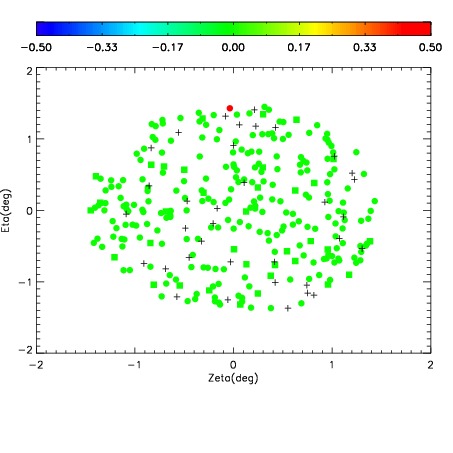
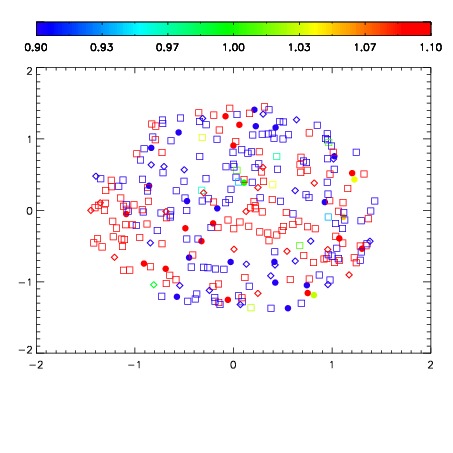
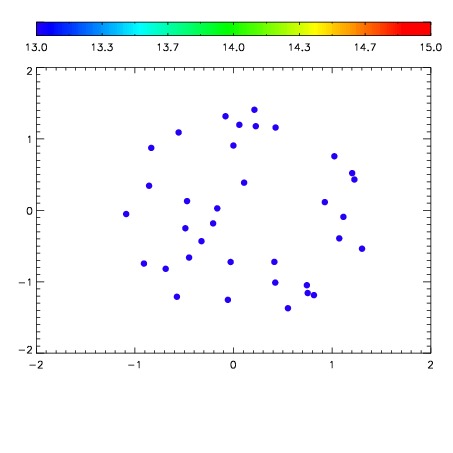

| Frame | Nreads | Zeropoints | Mag plots | Spatial mag deviation | Spatial sky 16325A emission deviations (filled: sky, open: star) | Spatial sky continuum emission | Spatial sky telluric CO2 absorption deviations (filled: H < 10) | |||||||||||||||||||||||
| 0 | 0 |
|
|
|
|
|
|
| IPAIR | NAME | SHIFT | NEWSHIFT | S/N | NAME | SHIFT | NEWSHIFT | S/N |
| 0 | 07520017 | 0.482062 | 0.00000 | 160.480 | 07520014 | 0.000872224 | 0.481190 | 161.865 |
| 1 | 07520012 | 0.479065 | 0.00299701 | 164.073 | 07520011 | 0.00000 | 0.482062 | 164.241 |
| 2 | 07520013 | 0.478904 | 0.00315800 | 162.358 | 07520018 | 0.00552738 | 0.476535 | 162.084 |
| 3 | 07520016 | 0.480474 | 0.00158802 | 158.687 | 07520015 | 0.00237366 | 0.479688 | 158.416 |