| Red | Green | Blue | |
| z | 17.64 | ||
| znorm | Inf | ||
| sky | -Inf | -Inf | -Inf |
| S/N | 28.3 | 48.2 | 51.1 |
| S/N(c) | 0.0 | 0.0 | 0.0 |
| SN(E/C) |
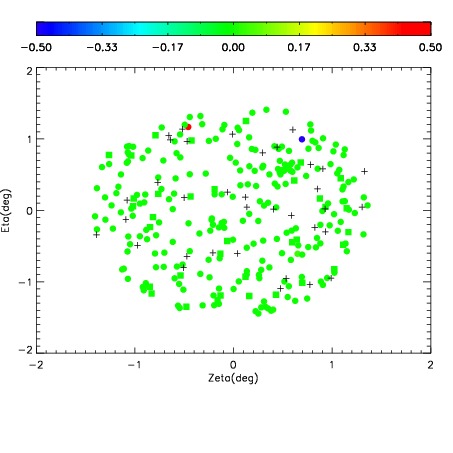
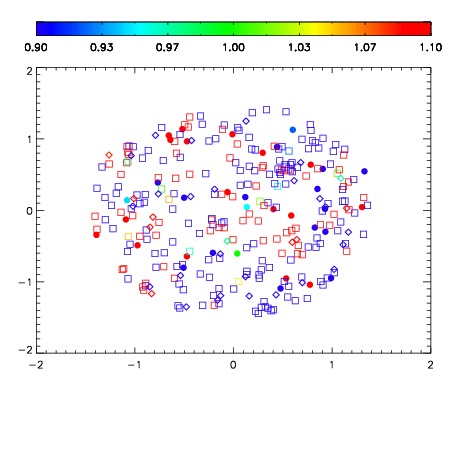
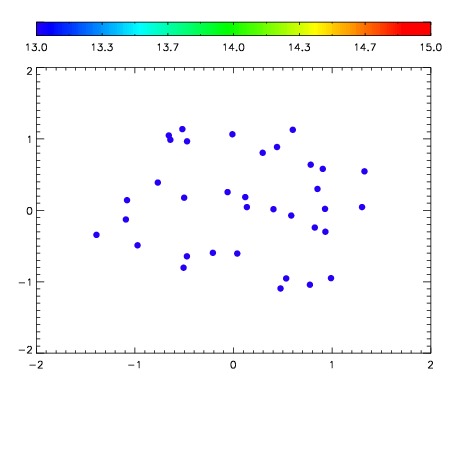

| Frame | Nreads | Zeropoints | Mag plots | Spatial mag deviation | Spatial sky 16325A emission deviations (filled: sky, open: star) | Spatial sky continuum emission | Spatial sky telluric CO2 absorption deviations (filled: H < 10) | |||||||||||||||||||||||
| 0 | 0 |
|
|
|
|
|
|
| IPAIR | NAME | SHIFT | NEWSHIFT | S/N | NAME | SHIFT | NEWSHIFT | S/N |
| 0 | 03660030 | 0.499125 | 0.00000 | 235.032 | 03660028 | 0.00113976 | 0.497985 | 229.934 |
| 1 | 03660029 | 0.497629 | 0.00149602 | 232.924 | 03660031 | 0.00307725 | 0.496048 | 226.978 |
| 2 | 03660026 | 0.499074 | 5.09918e-05 | 222.784 | 03660027 | 0.000706270 | 0.498419 | 225.488 |
| 3 | 03660025 | 0.497725 | 0.00139999 | 210.318 | 03660024 | 0.00000 | 0.499125 | 216.504 |