| Red | Green | Blue | |
| z | 17.64 | ||
| znorm | Inf | ||
| sky | -Inf | -Inf | -Inf |
| S/N | 34.9 | 58.6 | 62.5 |
| S/N(c) | 0.0 | 0.0 | 0.0 |
| SN(E/C) |
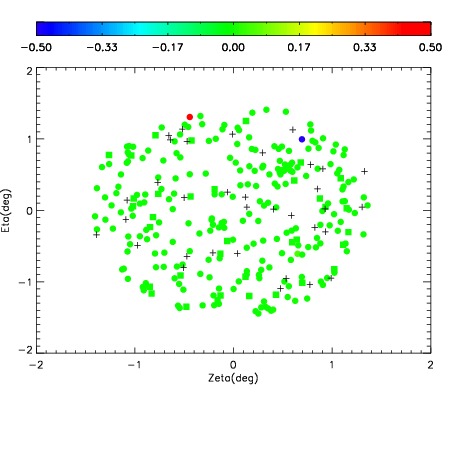
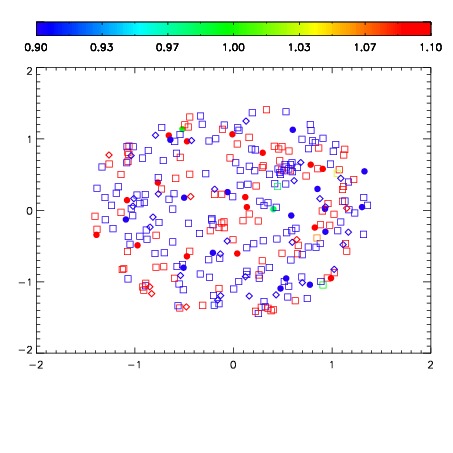
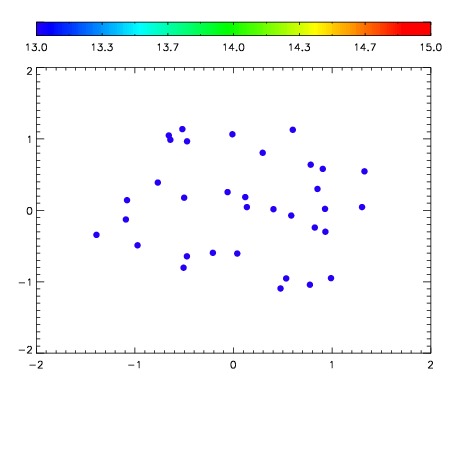

| Frame | Nreads | Zeropoints | Mag plots | Spatial mag deviation | Spatial sky 16325A emission deviations (filled: sky, open: star) | Spatial sky continuum emission | Spatial sky telluric CO2 absorption deviations (filled: H < 10) | |||||||||||||||||||||||
| 0 | 0 |
|
|
|
|
|
|
| IPAIR | NAME | SHIFT | NEWSHIFT | S/N | NAME | SHIFT | NEWSHIFT | S/N |
| 0 | 03720033 | 0.503400 | 0.00000 | 196.649 | 03720034 | -0.00220682 | 0.505607 | 199.410 |
| 1 | 03720032 | 0.502108 | 0.00129205 | 192.266 | 03720031 | -0.00315668 | 0.506557 | 193.295 |
| 2 | 03720029 | 0.502351 | 0.00104904 | 188.384 | 03720030 | -0.00307145 | 0.506471 | 185.258 |
| 3 | 03720028 | 0.501461 | 0.00193900 | 186.155 | 03720027 | -0.00319287 | 0.506593 | 180.795 |
| 4 | 03720025 | 0.500469 | 0.00293100 | 181.402 | 03720026 | -0.00156636 | 0.504966 | 179.959 |
| 5 | 03720024 | 0.501250 | 0.00215000 | 174.631 | 03720023 | 0.00000 | 0.503400 | 168.230 |