| Red | Green | Blue | |
| z | 17.64 | ||
| znorm | Inf | ||
| sky | -Inf | -Inf | -Inf |
| S/N | 30.7 | 51.0 | 53.1 |
| S/N(c) | 0.0 | 0.0 | 0.0 |
| SN(E/C) |
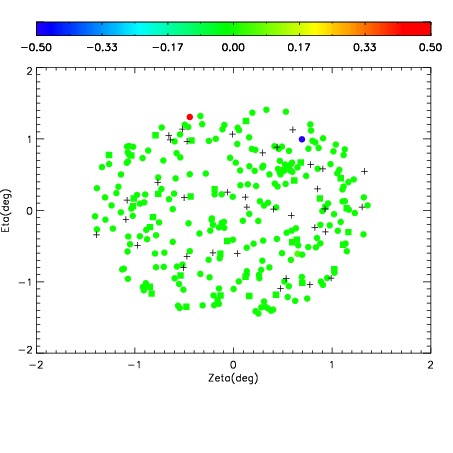
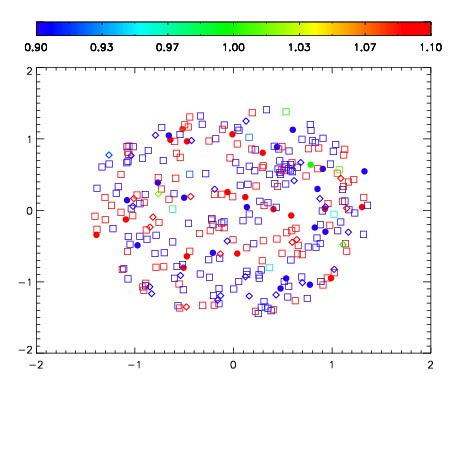
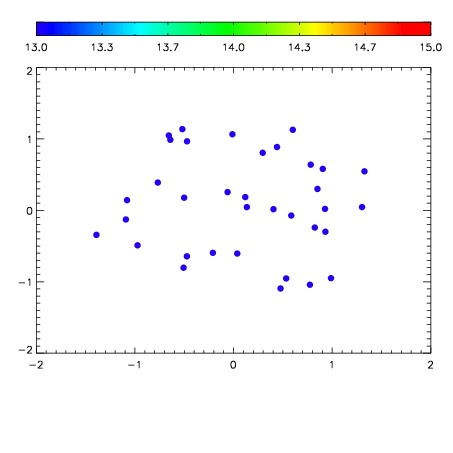

| Frame | Nreads | Zeropoints | Mag plots | Spatial mag deviation | Spatial sky 16325A emission deviations (filled: sky, open: star) | Spatial sky continuum emission | Spatial sky telluric CO2 absorption deviations (filled: H < 10) | |||||||||||||||||||||||
| 0 | 0 |
|
|
|
|
|
|
| IPAIR | NAME | SHIFT | NEWSHIFT | S/N | NAME | SHIFT | NEWSHIFT | S/N |
| 0 | 03950013 | 0.505453 | 0.00000 | 211.602 | 03950012 | 0.00000 | 0.505453 | 210.669 |
| 1 | 03950018 | 0.496857 | 0.00859600 | 218.859 | 03950019 | -0.00261152 | 0.508065 | 219.701 |
| 2 | 03950017 | 0.496710 | 0.00874299 | 218.289 | 03950015 | -1.05405e-05 | 0.505464 | 214.052 |
| 3 | 03950014 | 0.504633 | 0.000819981 | 217.826 | 03950016 | -0.00182166 | 0.507275 | 211.316 |