| Red | Green | Blue | |
| z | 17.64 | ||
| znorm | Inf | ||
| sky | -Inf | -NaN | -Inf |
| S/N | 22.7 | 40.4 | 41.6 |
| S/N(c) | 0.0 | 0.0 | 0.0 |
| SN(E/C) |
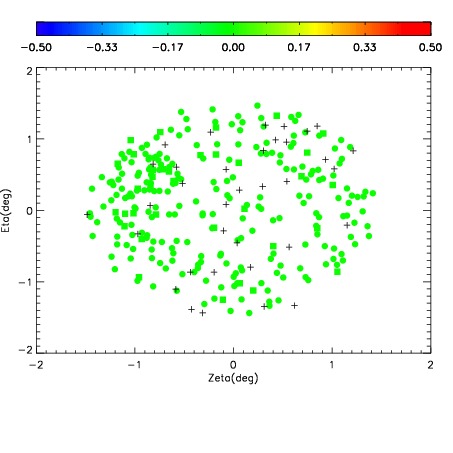
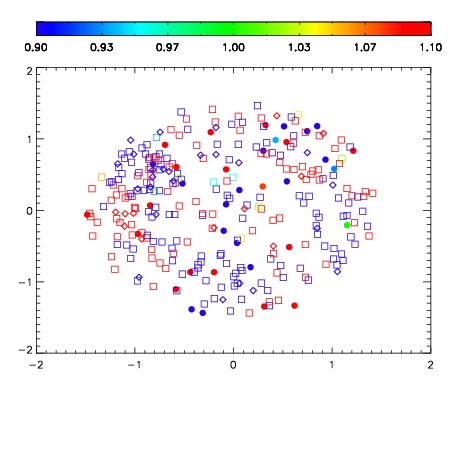
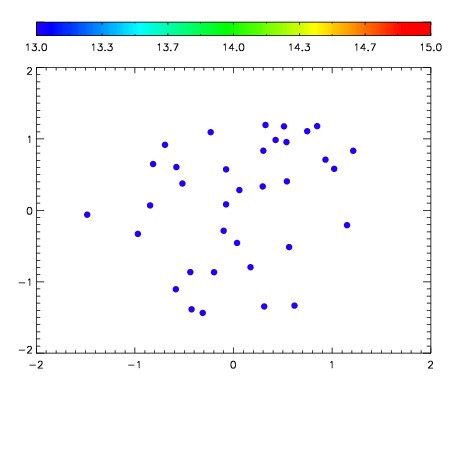

| Frame | Nreads | Zeropoints | Mag plots | Spatial mag deviation | Spatial sky 16325A emission deviations (filled: sky, open: star) | Spatial sky continuum emission | Spatial sky telluric CO2 absorption deviations (filled: H < 10) | |||||||||||||||||||||||
| 0 | 0 |
|
|
|
|
|
|
| IPAIR | NAME | SHIFT | NEWSHIFT | S/N | NAME | SHIFT | NEWSHIFT | S/N |
| 0 | 03980014 | 0.498937 | 0.00000 | 235.678 | 03980011 | 0.00134329 | 0.497594 | 238.775 |
| 1 | 03980009 | 0.497650 | 0.00128701 | 246.307 | 03980012 | -0.000223280 | 0.499160 | 244.376 |
| 2 | 03980010 | 0.498285 | 0.000652015 | 245.572 | 03980015 | 0.00133537 | 0.497602 | 243.280 |
| 3 | 03980013 | 0.498213 | 0.000724018 | 234.992 | 03980008 | 0.00000 | 0.498937 | 235.269 |