| Red | Green | Blue | |
| z | 17.64 | ||
| znorm | Inf | ||
| sky | -Inf | -Inf | -Inf |
| S/N | 29.1 | 49.4 | 51.5 |
| S/N(c) | 0.0 | 0.0 | 0.0 |
| SN(E/C) |

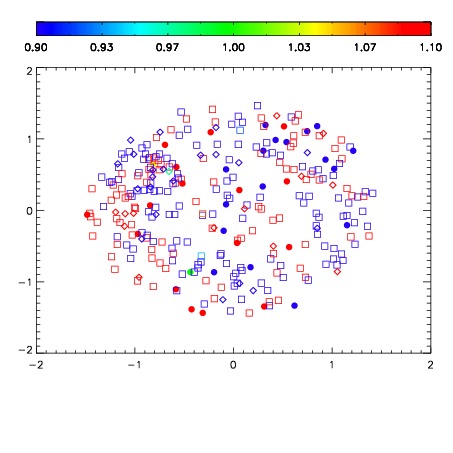
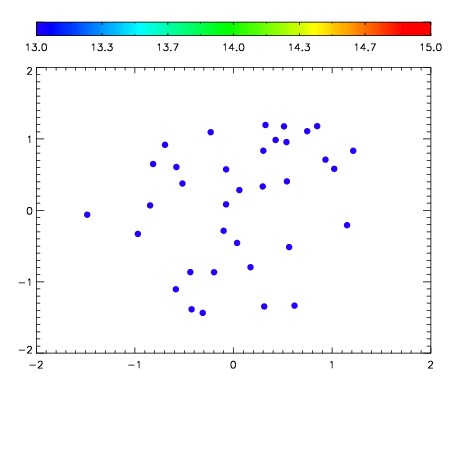

| Frame | Nreads | Zeropoints | Mag plots | Spatial mag deviation | Spatial sky 16325A emission deviations (filled: sky, open: star) | Spatial sky continuum emission | Spatial sky telluric CO2 absorption deviations (filled: H < 10) | |||||||||||||||||||||||
| 0 | 0 |
|
|
|
|
|
|
| IPAIR | NAME | SHIFT | NEWSHIFT | S/N | NAME | SHIFT | NEWSHIFT | S/N |
| 0 | 04040016 | 0.494601 | 0.00000 | 237.750 | 04040017 | 0.000689843 | 0.493911 | 241.790 |
| 1 | 04040011 | 0.491673 | 0.00292802 | 258.947 | 04040010 | 0.00000 | 0.494601 | 254.620 |
| 2 | 04040012 | 0.492345 | 0.00225601 | 256.967 | 04040013 | 0.00216621 | 0.492435 | 249.762 |
| 3 | 04040015 | 0.493461 | 0.00114000 | 245.832 | 04040014 | 0.000504109 | 0.494097 | 243.636 |