| Red | Green | Blue | |
| z | 17.64 | ||
| znorm | Inf | ||
| sky | -Inf | -Inf | -Inf |
| S/N | 27.7 | 46.3 | 48.4 |
| S/N(c) | 0.0 | 0.0 | 0.0 |
| SN(E/C) |
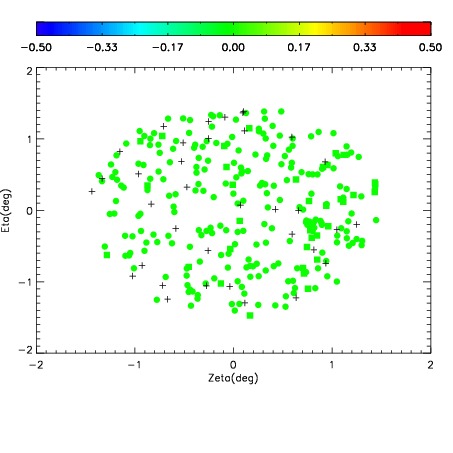
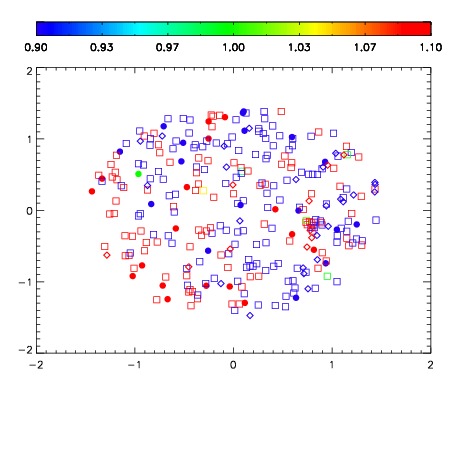
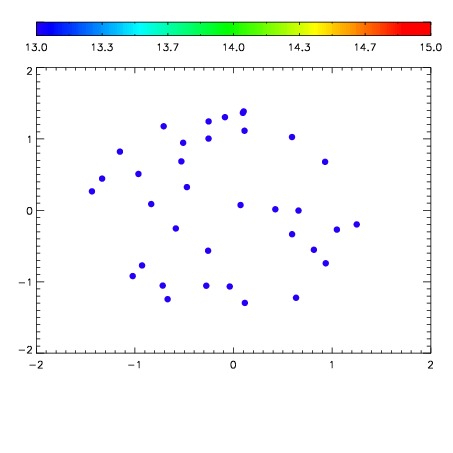

| Frame | Nreads | Zeropoints | Mag plots | Spatial mag deviation | Spatial sky 16325A emission deviations (filled: sky, open: star) | Spatial sky continuum emission | Spatial sky telluric CO2 absorption deviations (filled: H < 10) | |||||||||||||||||||||||
| 0 | 0 |
|
|
|
|
|
|
| IPAIR | NAME | SHIFT | NEWSHIFT | S/N | NAME | SHIFT | NEWSHIFT | S/N |
| 0 | 07540013 | 0.475819 | 0.00000 | 170.927 | 07540014 | -0.000565849 | 0.476385 | 172.838 |
| 1 | 07540017 | 0.475237 | 0.000581980 | 179.689 | 07540018 | 0.00370595 | 0.472113 | 175.178 |
| 2 | 07540016 | 0.474839 | 0.000979990 | 175.002 | 07540015 | 6.30695e-05 | 0.475756 | 172.957 |
| 3 | 07540012 | 0.475372 | 0.000447005 | 169.310 | 07540011 | 0.00000 | 0.475819 | 165.338 |