| Red | Green | Blue | |
| z | 17.64 | ||
| znorm | Inf | ||
| sky | -Inf | -Inf | -Inf |
| S/N | 21.7 | 37.3 | 39.5 |
| S/N(c) | 0.0 | 0.0 | 0.0 |
| SN(E/C) |
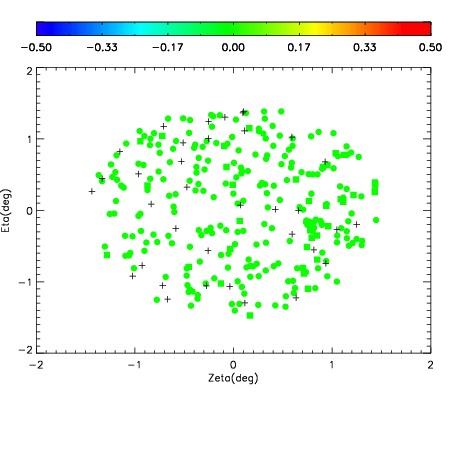
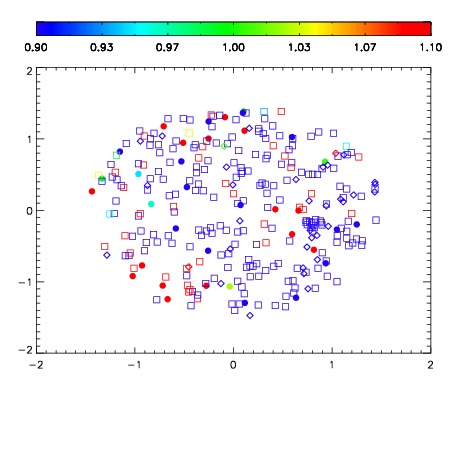
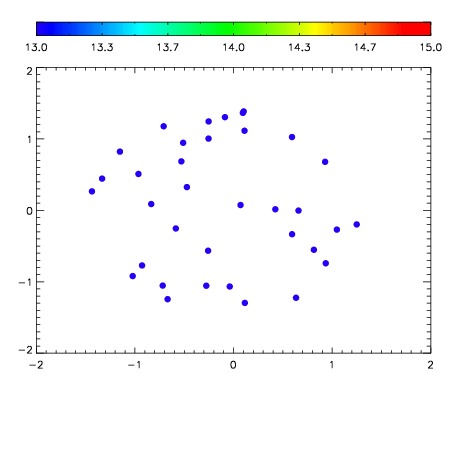

| Frame | Nreads | Zeropoints | Mag plots | Spatial mag deviation | Spatial sky 16325A emission deviations (filled: sky, open: star) | Spatial sky continuum emission | Spatial sky telluric CO2 absorption deviations (filled: H < 10) | |||||||||||||||||||||||
| 0 | 0 |
|
|
|
|
|
|
| IPAIR | NAME | SHIFT | NEWSHIFT | S/N | NAME | SHIFT | NEWSHIFT | S/N |
| 0 | 09990066 | 0.473414 | 0.00000 | 120.166 | 09990068 | 0.00172363 | 0.471690 | 128.828 |
| 1 | 09990070 | 0.472026 | 0.00138801 | 159.387 | 09990071 | 0.00251835 | 0.470896 | 157.037 |
| 2 | 09990069 | 0.472476 | 0.000937998 | 129.560 | 09990067 | 0.000909700 | 0.472504 | 155.981 |