| Red | Green | Blue | |
| z | 17.64 | ||
| znorm | Inf | ||
| sky | -Inf | -Inf | -Inf |
| S/N | 32.6 | 55.6 | 60.2 |
| S/N(c) | 0.0 | 0.0 | 0.0 |
| SN(E/C) |

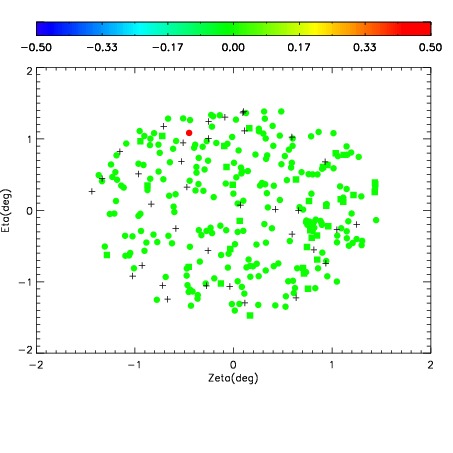
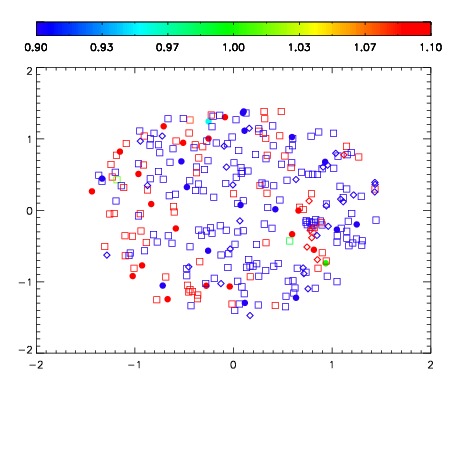
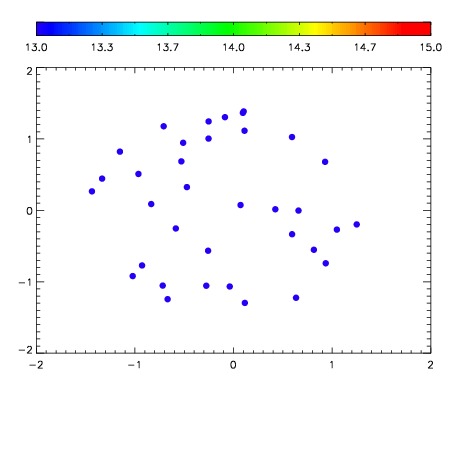

| Frame | Nreads | Zeropoints | Mag plots | Spatial mag deviation | Spatial sky 16325A emission deviations (filled: sky, open: star) | Spatial sky continuum emission | Spatial sky telluric CO2 absorption deviations (filled: H < 10) | |||||||||||||||||||||||
| 0 | 0 |
|
|
|
|
|
|
| IPAIR | NAME | SHIFT | NEWSHIFT | S/N | NAME | SHIFT | NEWSHIFT | S/N |
| 0 | 10220074 | 0.493947 | 0.00000 | 170.583 | 10220076 | -0.000578961 | 0.494526 | 171.468 |
| 1 | 10220078 | 0.493453 | 0.000494003 | 172.491 | 10220075 | -0.000160188 | 0.494107 | 173.244 |
| 2 | 10220081 | 0.491861 | 0.00208601 | 172.154 | 10220079 | -0.00141301 | 0.495360 | 173.156 |
| 3 | 10220077 | 0.492740 | 0.00120699 | 170.328 | 10220080 | -0.00154267 | 0.495490 | 170.585 |
| 4 | 10220073 | 0.493653 | 0.000294000 | 170.002 | 10220072 | 0.00000 | 0.493947 | 167.928 |