| Red | Green | Blue | |
| z | 17.64 | ||
| znorm | Inf | ||
| sky | -Inf | -Inf | -Inf |
| S/N | 32.7 | 55.8 | 63.2 |
| S/N(c) | 0.0 | 0.0 | 0.0 |
| SN(E/C) |
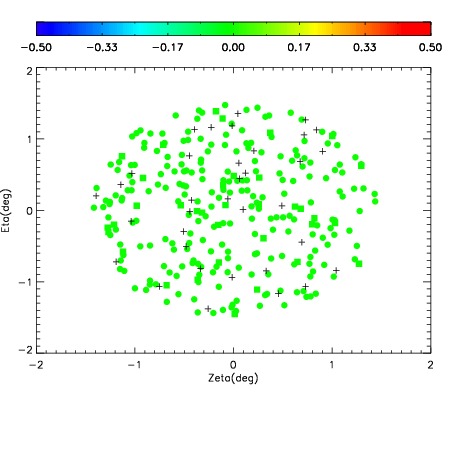
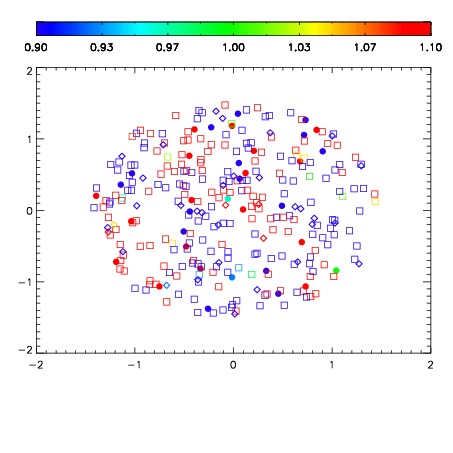
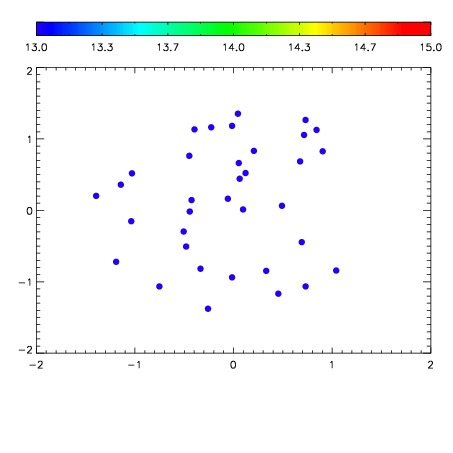

| Frame | Nreads | Zeropoints | Mag plots | Spatial mag deviation | Spatial sky 16325A emission deviations (filled: sky, open: star) | Spatial sky continuum emission | Spatial sky telluric CO2 absorption deviations (filled: H < 10) | |||||||||||||||||||||||
| 0 | 0 |
|
|
|
|
|
|
| IPAIR | NAME | SHIFT | NEWSHIFT | S/N | NAME | SHIFT | NEWSHIFT | S/N |
| 0 | 03670061 | 0.500476 | 0.00000 | 236.904 | 03670062 | 0.000233815 | 0.500242 | 239.344 |
| 1 | 03670064 | 0.498199 | 0.00227702 | 242.606 | 03670066 | 0.00284173 | 0.497634 | 242.070 |
| 2 | 03670060 | 0.496082 | 0.00439399 | 242.113 | 03670063 | 0.00114669 | 0.499329 | 240.945 |
| 3 | 03670065 | 0.500356 | 0.000119984 | 239.730 | 03670059 | 0.00000 | 0.500476 | 240.546 |