| Red | Green | Blue | |
| z | 17.64 | ||
| znorm | Inf | ||
| sky | -Inf | -Inf | -Inf |
| S/N | 17.2 | 32.1 | 33.8 |
| S/N(c) | 0.0 | 0.0 | 0.0 |
| SN(E/C) |
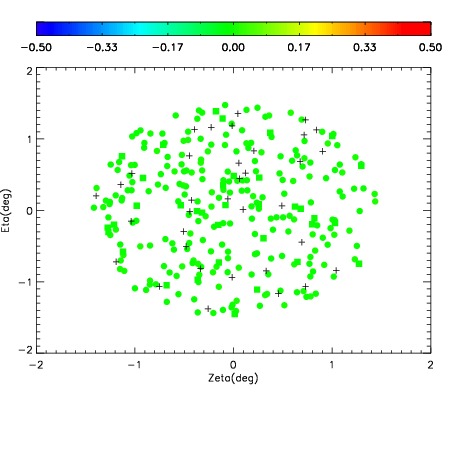
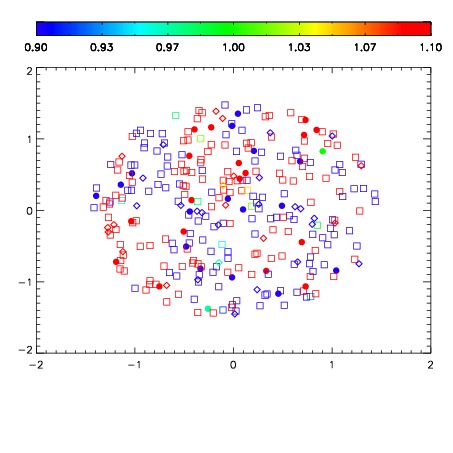
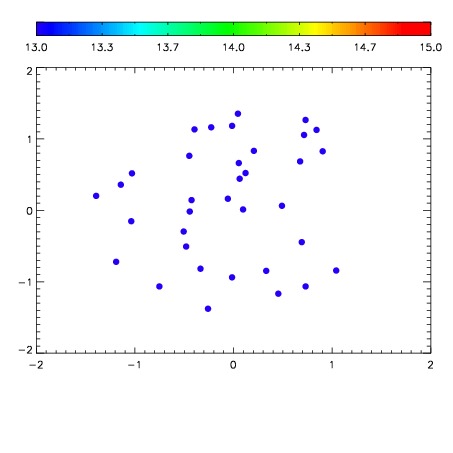

| Frame | Nreads | Zeropoints | Mag plots | Spatial mag deviation | Spatial sky 16325A emission deviations (filled: sky, open: star) | Spatial sky continuum emission | Spatial sky telluric CO2 absorption deviations (filled: H < 10) | |||||||||||||||||||||||
| 0 | 0 |
|
|
|
|
|
|
| IPAIR | NAME | SHIFT | NEWSHIFT | S/N | NAME | SHIFT | NEWSHIFT | S/N |
| 0 | 03790016 | 0.507301 | 0.00000 | 224.567 | 03790010 | 0.00000 | 0.507301 | 176.020 |
| 1 | 03790012 | 0.505289 | 0.00201195 | 170.641 | 03790014 | 0.000175404 | 0.507126 | 155.265 |
| 2 | 03790011 | 0.505229 | 0.00207198 | 165.466 | 03790017 | 0.00318876 | 0.504112 | 145.278 |
| 3 | 03790015 | 0.506746 | 0.000554979 | 140.930 | 03790013 | 0.00159558 | 0.505705 | 85.7465 |