| Red | Green | Blue | |
| z | 17.64 | ||
| znorm | Inf | ||
| sky | -Inf | -Inf | -Inf |
| S/N | 29.5 | 49.1 | 53.9 |
| S/N(c) | 0.0 | 0.0 | 0.0 |
| SN(E/C) |
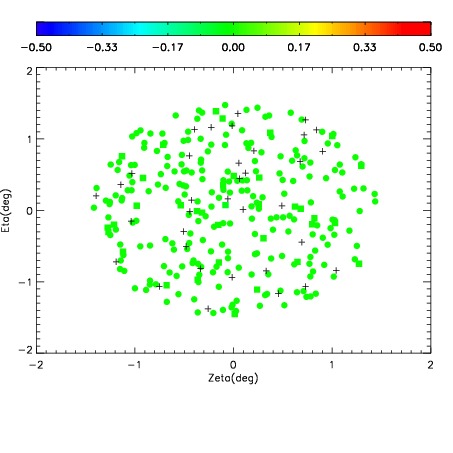
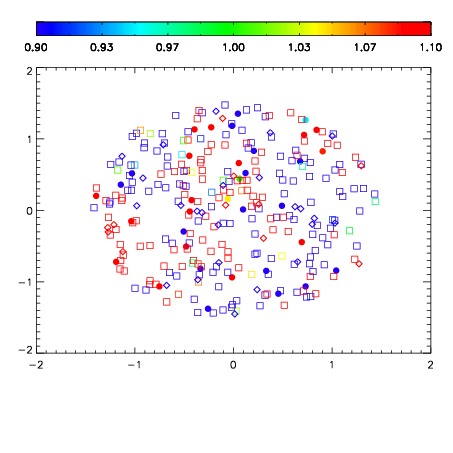


| Frame | Nreads | Zeropoints | Mag plots | Spatial mag deviation | Spatial sky 16325A emission deviations (filled: sky, open: star) | Spatial sky continuum emission | Spatial sky telluric CO2 absorption deviations (filled: H < 10) | |||||||||||||||||||||||
| 0 | 0 |
|
|
|
|
|
|
| IPAIR | NAME | SHIFT | NEWSHIFT | S/N | NAME | SHIFT | NEWSHIFT | S/N |
| 0 | 04060016 | 0.505285 | 0.00000 | 224.841 | 04060010 | 0.00000 | 0.505285 | 223.003 |
| 1 | 04060011 | 0.499404 | 0.00588101 | 228.593 | 04060013 | 0.000224718 | 0.505060 | 226.809 |
| 2 | 04060012 | 0.500461 | 0.00482404 | 227.473 | 04060017 | 0.00255126 | 0.502734 | 225.493 |
| 3 | 04060015 | 0.503743 | 0.00154203 | 223.496 | 04060014 | 0.00149937 | 0.503786 | 222.622 |