| Red | Green | Blue | |
| z | 17.64 | ||
| znorm | Inf | ||
| sky | -Inf | -Inf | -Inf |
| S/N | 25.4 | 43.8 | 53.5 |
| S/N(c) | 0.0 | 0.0 | 0.0 |
| SN(E/C) |

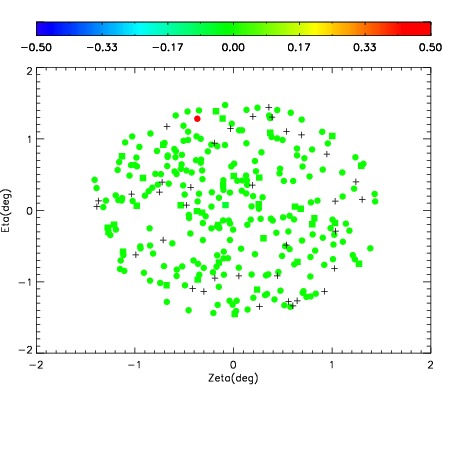
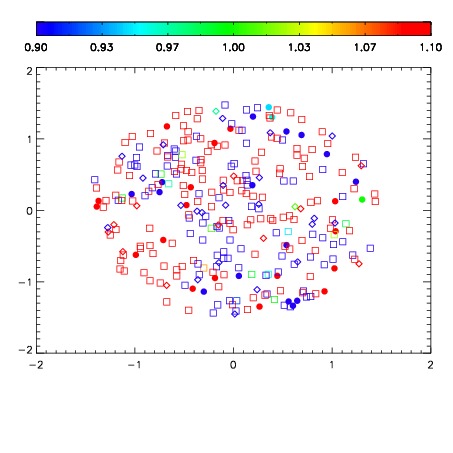
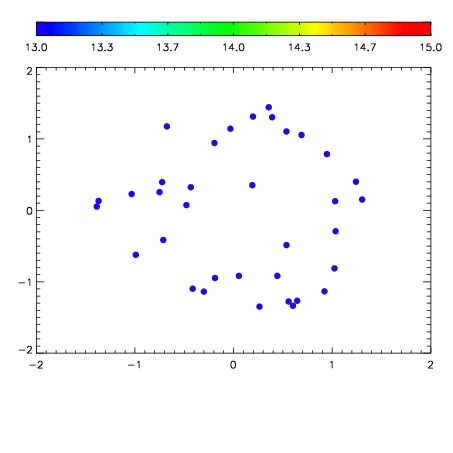

| Frame | Nreads | Zeropoints | Mag plots | Spatial mag deviation | Spatial sky 16325A emission deviations (filled: sky, open: star) | Spatial sky continuum emission | Spatial sky telluric CO2 absorption deviations (filled: H < 10) | |||||||||||||||||||||||
| 0 | 0 |
|
|
|
|
|
|
| IPAIR | NAME | SHIFT | NEWSHIFT | S/N | NAME | SHIFT | NEWSHIFT | S/N |
| 0 | 03680062 | 0.504608 | 0.00000 | 256.365 | 03680067 | 0.000669783 | 0.503938 | 218.079 |
| 1 | 03680066 | 0.502131 | 0.00247699 | 261.772 | 03680060 | 0.00000 | 0.504608 | 263.183 |
| 2 | 03680061 | 0.504361 | 0.000247002 | 260.516 | 03680063 | 0.00164647 | 0.502962 | 262.593 |
| 3 | 03680065 | 0.501194 | 0.00341398 | 258.612 | 03680064 | 0.00184307 | 0.502765 | 262.410 |