| Red | Green | Blue | |
| z | 17.64 | ||
| znorm | Inf | ||
| sky | -Inf | -Inf | -Inf |
| S/N | 23.9 | 42.8 | 44.5 |
| S/N(c) | 0.0 | 0.0 | 0.0 |
| SN(E/C) |

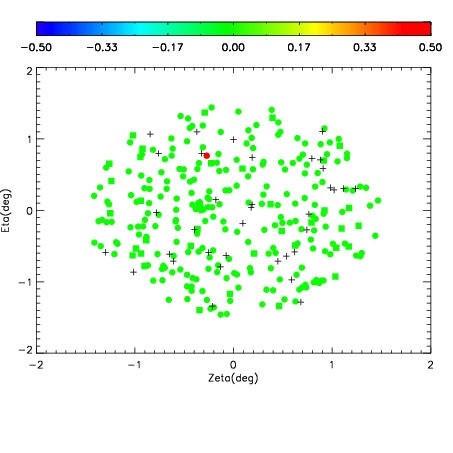
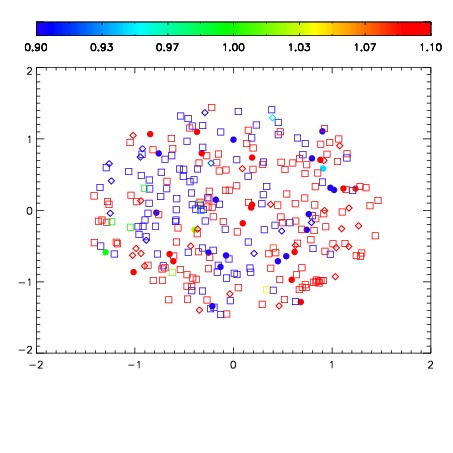
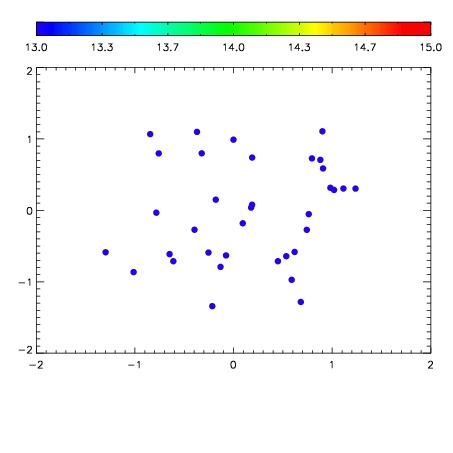

| Frame | Nreads | Zeropoints | Mag plots | Spatial mag deviation | Spatial sky 16325A emission deviations (filled: sky, open: star) | Spatial sky continuum emission | Spatial sky telluric CO2 absorption deviations (filled: H < 10) | |||||||||||||||||||||||
| 0 | 0 |
|
|
|
|
|
|
| IPAIR | NAME | SHIFT | NEWSHIFT | S/N | NAME | SHIFT | NEWSHIFT | S/N |
| 0 | 10490086 | 0.499105 | 0.00000 | 164.831 | 10490085 | 0.000216837 | 0.498888 | 162.939 |
| 1 | 10490095 | 0.497302 | 0.00180301 | 200.947 | 10490096 | -0.000760218 | 0.499865 | 203.482 |
| 2 | 10490091 | 0.496553 | 0.00255200 | 197.751 | 10490089 | -0.00162278 | 0.500728 | 193.342 |
| 3 | 10490090 | 0.496355 | 0.00275001 | 191.796 | 10490088 | -0.00127680 | 0.500382 | 185.262 |
| 4 | 10490083 | 0.498323 | 0.000782013 | 171.245 | 10490092 | -0.000757769 | 0.499863 | 175.541 |
| 5 | 10490087 | 0.499028 | 7.70092e-05 | 170.531 | 10490093 | -0.000544499 | 0.499649 | 167.508 |
| 6 | 10490094 | 0.497214 | 0.00189102 | 166.681 | 10490084 | 0.000710655 | 0.498394 | 166.837 |
| 7 | 10490082 | 0.498489 | 0.000616014 | 164.579 | 10490081 | 0.00000 | 0.499105 | 153.539 |