| Red | Green | Blue | |
| z | 17.64 | ||
| znorm | Inf | ||
| sky | -Inf | -Inf | -Inf |
| S/N | 21.1 | 38.9 | 45.2 |
| S/N(c) | 0.0 | 0.0 | 0.0 |
| SN(E/C) |
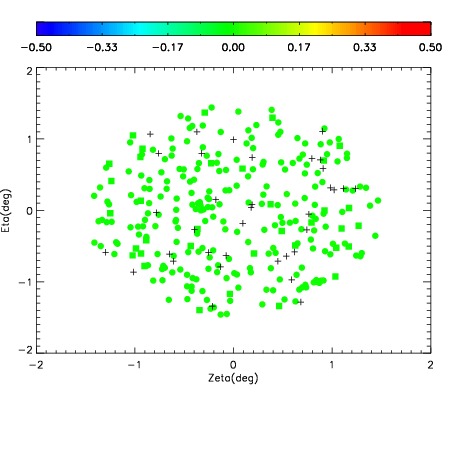
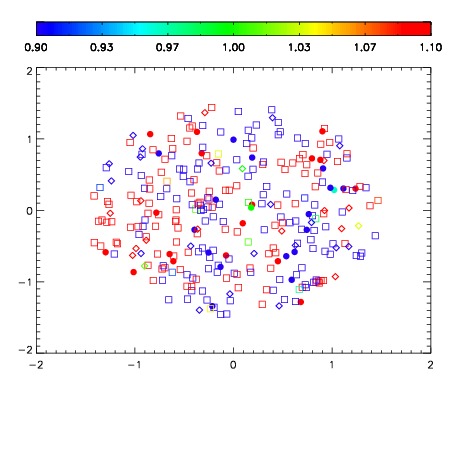
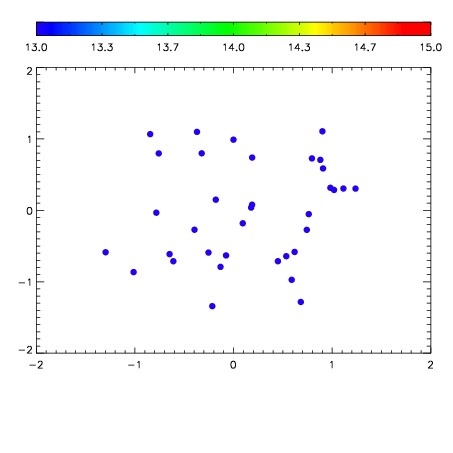

| Frame | Nreads | Zeropoints | Mag plots | Spatial mag deviation | Spatial sky 16325A emission deviations (filled: sky, open: star) | Spatial sky continuum emission | Spatial sky telluric CO2 absorption deviations (filled: H < 10) | |||||||||||||||||||||||
| 0 | 0 |
|
|
|
|
|
|
| IPAIR | NAME | SHIFT | NEWSHIFT | S/N | NAME | SHIFT | NEWSHIFT | S/N |
| 0 | 10890080 | 0.510735 | 0.00000 | 186.521 | 10890074 | -0.00194023 | 0.512675 | 190.732 |
| 1 | 10890076 | 0.507134 | 0.00360096 | 198.370 | 10890077 | -0.00207427 | 0.512809 | 197.555 |
| 2 | 10890075 | 0.506388 | 0.00434697 | 191.271 | 10890081 | 0.000643403 | 0.510092 | 196.433 |
| 3 | 10890072 | 0.508774 | 0.00196099 | 180.157 | 10890073 | -0.00155379 | 0.512289 | 188.454 |
| 4 | 10890071 | 0.508674 | 0.00206095 | 165.532 | 10890078 | -0.00219417 | 0.512929 | 174.647 |
| 5 | 10890079 | 0.509454 | 0.00128096 | 163.795 | 10890070 | 0.00000 | 0.510735 | 135.819 |