| Red | Green | Blue | |
| z | 17.64 | ||
| znorm | Inf | ||
| sky | -Inf | -Inf | -Inf |
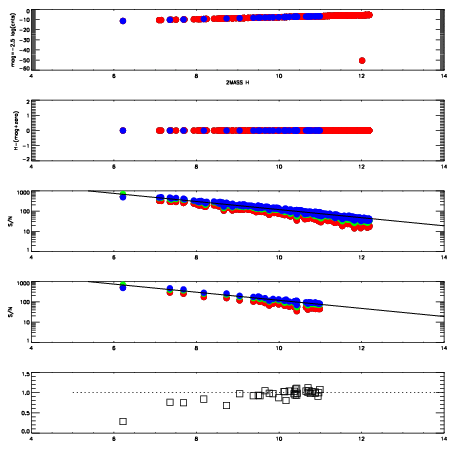
| S/N | 19.4 | 35.1 | 38.7 |
| S/N(c) | 0.0 | 0.0 | 0.0 |
| SN(E/C) |
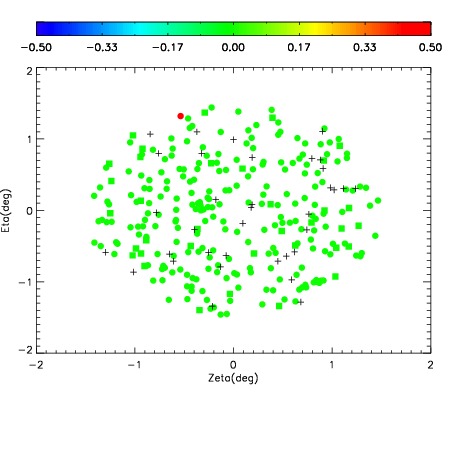
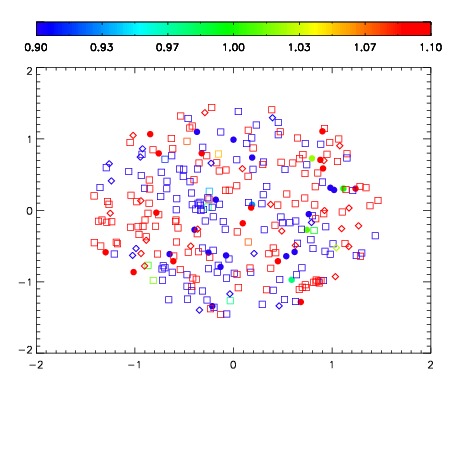
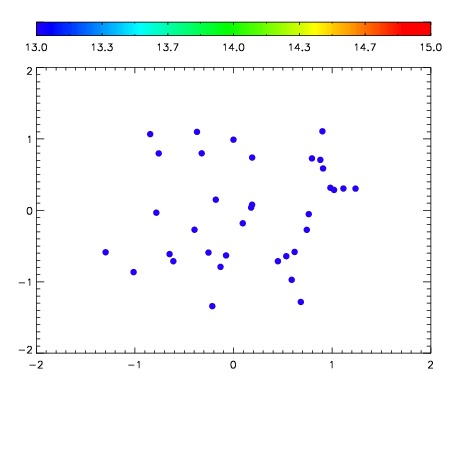

| Frame | Nreads | Zeropoints | Mag plots | Spatial mag deviation | Spatial sky 16325A emission deviations (filled: sky, open: star) | Spatial sky continuum emission | Spatial sky telluric CO2 absorption deviations (filled: H < 10) | |||||||||||||||||||||||
| 0 | 0 |
|
|
|
|
|
|
| IPAIR | NAME | SHIFT | NEWSHIFT | S/N | NAME | SHIFT | NEWSHIFT | S/N |
| 0 | 11060069 | 0.481996 | 0.00000 | 210.172 | 11060070 | 0.000982598 | 0.481013 | 214.925 |
| 1 | 11060068 | 0.481453 | 0.000542998 | 205.646 | 11060067 | -0.00235825 | 0.484354 | 196.317 |
| 2 | 11060064 | 0.481176 | 0.000820011 | 186.444 | 11060066 | -0.00213397 | 0.484130 | 190.343 |
| 3 | 11060065 | 0.481565 | 0.000431001 | 165.060 | 11060063 | 0.00000 | 0.481996 | 189.413 |