| Red | Green | Blue | |
| z | 17.64 | ||
| znorm | Inf | ||
| sky | -Inf | -Inf | -Inf |
| S/N | 21.8 | 38.1 | 41.6 |
| S/N(c) | 0.0 | 0.0 | 0.0 |
| SN(E/C) |
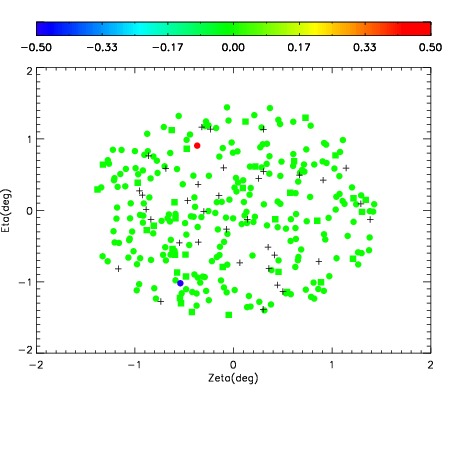
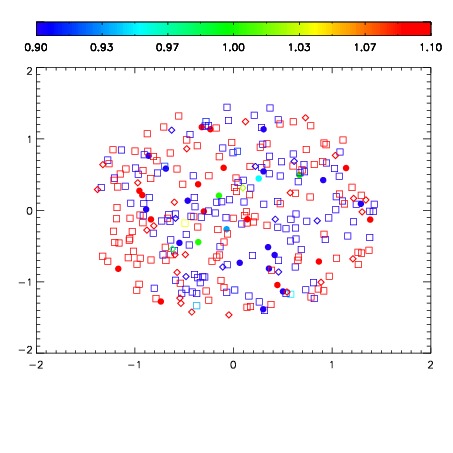
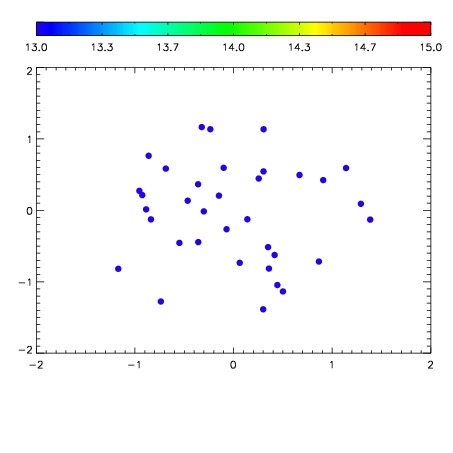

| Frame | Nreads | Zeropoints | Mag plots | Spatial mag deviation | Spatial sky 16325A emission deviations (filled: sky, open: star) | Spatial sky continuum emission | Spatial sky telluric CO2 absorption deviations (filled: H < 10) | |||||||||||||||||||||||
| 0 | 0 |
|
|
|
|
|
|
| IPAIR | NAME | SHIFT | NEWSHIFT | S/N | NAME | SHIFT | NEWSHIFT | S/N |
| 0 | 08140017 | 0.509334 | 0.00000 | 159.922 | 08140011 | 0.00000 | 0.509334 | 160.097 |
| 1 | 08140013 | 0.507636 | 0.00169802 | 179.770 | 08140015 | -0.00473458 | 0.514069 | 176.580 |
| 2 | 08140012 | 0.506410 | 0.00292403 | 168.473 | 08140014 | -0.00218613 | 0.511520 | 176.446 |
| 3 | 08140016 | 0.507419 | 0.00191504 | 165.643 | 08140018 | -0.00146147 | 0.510795 | 165.659 |