| Red | Green | Blue | |
| z | 17.64 | ||
| znorm | Inf | ||
| sky | -Inf | -Inf | -Inf |
| S/N | 31.6 | 55.3 | 62.0 |
| S/N(c) | 0.0 | 0.0 | 0.0 |
| SN(E/C) |
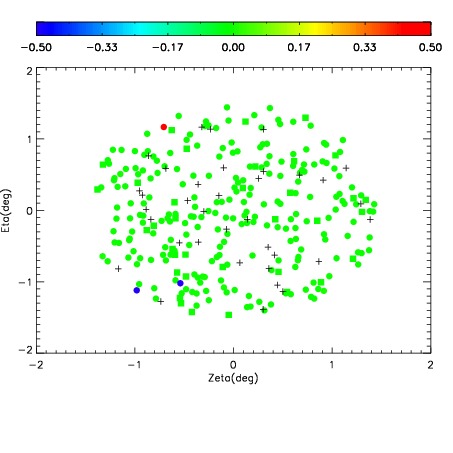
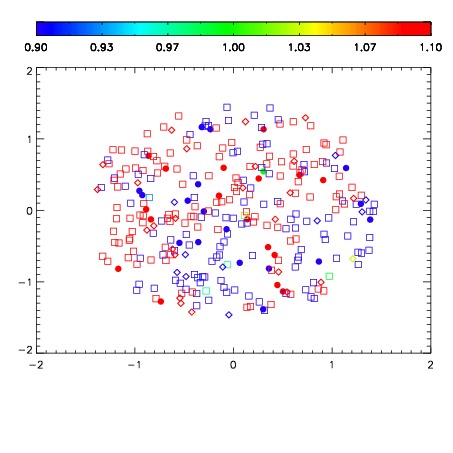
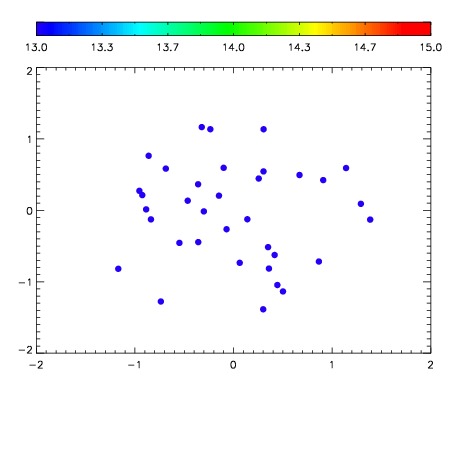

| Frame | Nreads | Zeropoints | Mag plots | Spatial mag deviation | Spatial sky 16325A emission deviations (filled: sky, open: star) | Spatial sky continuum emission | Spatial sky telluric CO2 absorption deviations (filled: H < 10) | |||||||||||||||||||||||
| 0 | 0 |
|
|
|
|
|
|
| IPAIR | NAME | SHIFT | NEWSHIFT | S/N | NAME | SHIFT | NEWSHIFT | S/N |
| 0 | 10540093 | 0.498245 | 0.00000 | 194.900 | 10540092 | 0.00000 | 0.498245 | 187.319 |
| 1 | 10540094 | 0.497501 | 0.000744015 | 202.513 | 10540095 | -0.00195853 | 0.500204 | 205.523 |
| 2 | 10540097 | 0.495743 | 0.00250199 | 201.877 | 10540096 | -0.00207956 | 0.500325 | 204.185 |
| 3 | 10540098 | 0.495784 | 0.00246099 | 199.962 | 10540099 | -0.00119636 | 0.499441 | 195.729 |
| 4 | 10540101 | 0.494988 | 0.00325701 | 190.814 | 10540100 | -0.00140685 | 0.499652 | 187.103 |
| 5 | 10540102 | 0.494686 | 0.00355899 | 188.297 | 10540103 | -0.00145783 | 0.499703 | 181.393 |
| 6 | 10540106 | 0.495114 | 0.00313100 | 147.546 | 10540104 | -0.00201104 | 0.500256 | 170.288 |
| 7 | 10540105 | 0.494690 | 0.00355500 | 144.838 | 10540107 | -0.000382532 | 0.498628 | 76.8500 |