| Red | Green | Blue | |
| z | 17.64 | ||
| znorm | Inf | ||
| sky | -Inf | -Inf | -Inf |
| S/N | 16.8 | 31.8 | 33.6 |
| S/N(c) | 0.0 | 0.0 | 0.0 |
| SN(E/C) |
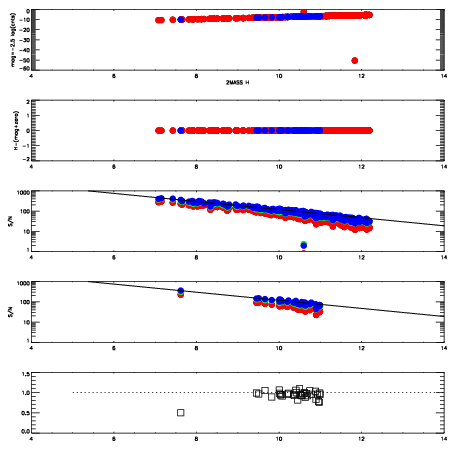
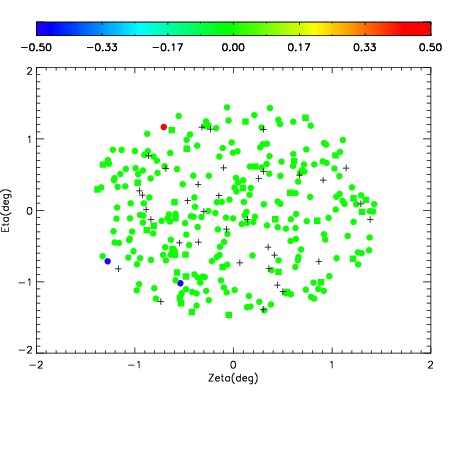
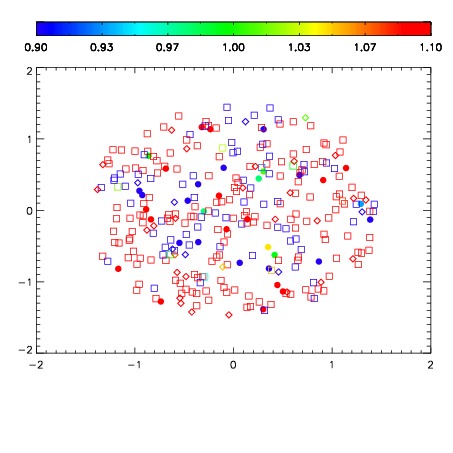
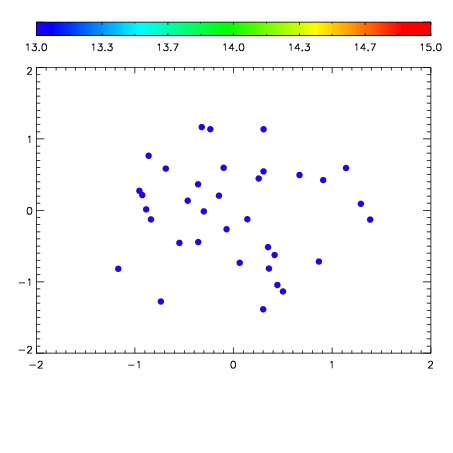

| Frame | Nreads | Zeropoints | Mag plots | Spatial mag deviation | Spatial sky 16325A emission deviations (filled: sky, open: star) | Spatial sky continuum emission | Spatial sky telluric CO2 absorption deviations (filled: H < 10) | |||||||||||||||||||||||
| 0 | 0 |
|
|
|
|
|
|
| IPAIR | NAME | SHIFT | NEWSHIFT | S/N | NAME | SHIFT | NEWSHIFT | S/N |
| 0 | 10780013 | 0.490413 | 0.00000 | 155.445 | 10780018 | -0.00290340 | 0.493316 | 150.823 |
| 1 | 10780016 | 0.489751 | 0.000661999 | 164.252 | 10780014 | -0.00461166 | 0.495025 | 161.038 |
| 2 | 10780017 | 0.489724 | 0.000689000 | 158.828 | 10780015 | -0.00339072 | 0.493804 | 154.886 |
| 3 | 10780012 | 0.490243 | 0.000170022 | 149.482 | 10780011 | 0.00000 | 0.490413 | 145.853 |