| Red | Green | Blue | |
| z | 17.64 | ||
| znorm | Inf | ||
| sky | -Inf | -NaN | -Inf |
| S/N | 25.3 | 45.1 | 47.8 |
| S/N(c) | 0.0 | 0.0 | 0.0 |
| SN(E/C) |
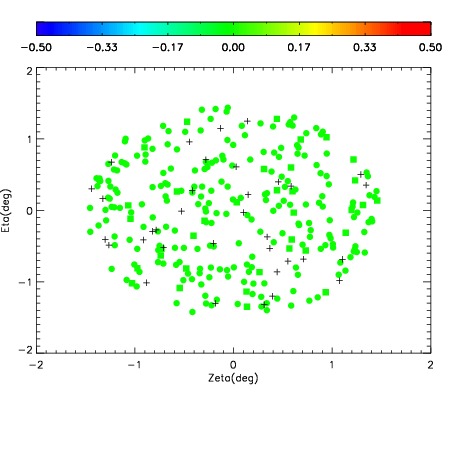
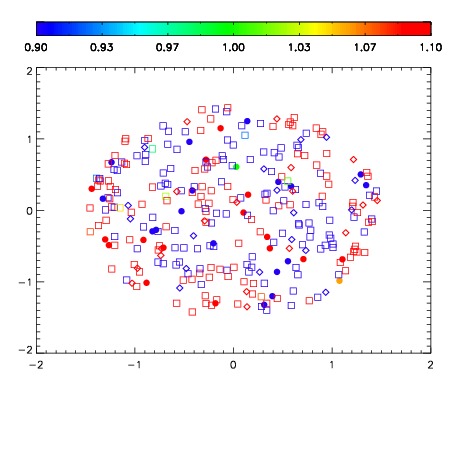
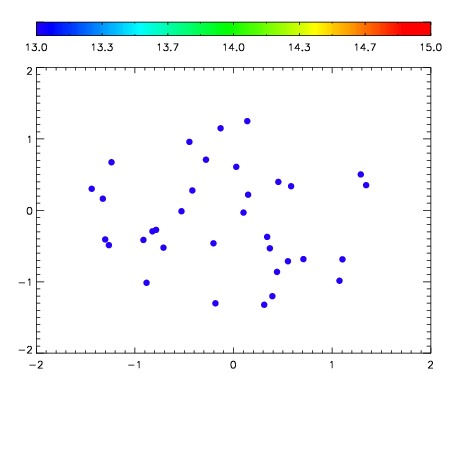

| Frame | Nreads | Zeropoints | Mag plots | Spatial mag deviation | Spatial sky 16325A emission deviations (filled: sky, open: star) | Spatial sky continuum emission | Spatial sky telluric CO2 absorption deviations (filled: H < 10) | |||||||||||||||||||||||
| 0 | 0 |
|
|
|
|
|
|
| IPAIR | NAME | SHIFT | NEWSHIFT | S/N | NAME | SHIFT | NEWSHIFT | S/N |
| 0 | 06670098 | 0.489247 | 0.00000 | 170.677 | 06670099 | 0.00423164 | 0.485015 | 168.524 |
| 1 | 06670101 | 0.489022 | 0.000225008 | 173.091 | 06670100 | 0.00200043 | 0.487247 | 174.251 |
| 2 | 06670097 | 0.488310 | 0.000936985 | 166.072 | 06670096 | 0.000945462 | 0.488302 | 155.541 |
| 3 | 06670093 | 0.486927 | 0.00231999 | 150.013 | 06670095 | 0.00214691 | 0.487100 | 150.812 |
| 4 | 06670094 | 0.487044 | 0.00220299 | 149.930 | 06670092 | 0.00000 | 0.489247 | 141.334 |