| Red | Green | Blue | |
| z | 17.64 | ||
| znorm | Inf | ||
| sky | -Inf | -Inf | -Inf |
| S/N | 25.9 | 44.8 | 49.9 |
| S/N(c) | 0.0 | 0.0 | 0.0 |
| SN(E/C) |
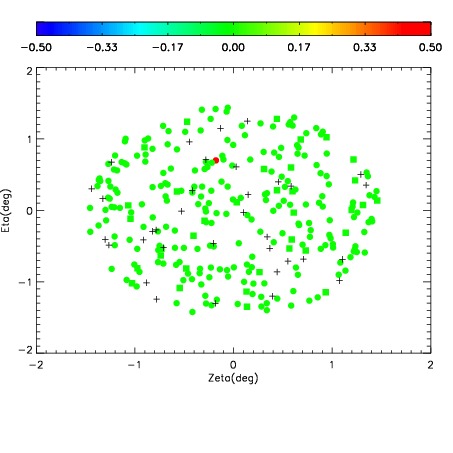

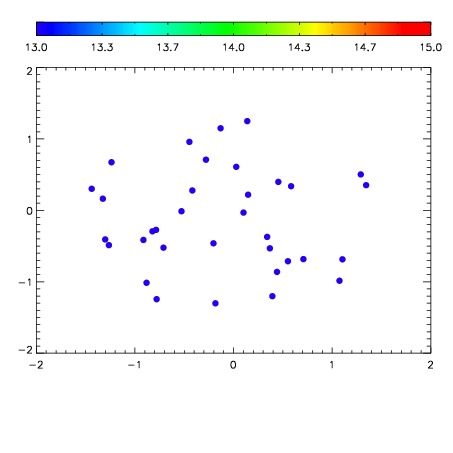

| Frame | Nreads | Zeropoints | Mag plots | Spatial mag deviation | Spatial sky 16325A emission deviations (filled: sky, open: star) | Spatial sky continuum emission | Spatial sky telluric CO2 absorption deviations (filled: H < 10) | |||||||||||||||||||||||
| 0 | 0 |
|
|
|
|
|
|
| IPAIR | NAME | SHIFT | NEWSHIFT | S/N | NAME | SHIFT | NEWSHIFT | S/N |
| 0 | 06930090 | 0.495881 | 0.00000 | 187.165 | 06930091 | 0.00103959 | 0.494841 | 185.992 |
| 1 | 06930089 | 0.495468 | 0.000413001 | 183.961 | 06930087 | -0.000528174 | 0.496409 | 185.079 |
| 2 | 06930086 | 0.493123 | 0.00275800 | 179.306 | 06930088 | -0.000355419 | 0.496236 | 180.663 |
| 3 | 06930085 | 0.493268 | 0.00261298 | 173.952 | 06930084 | 0.00000 | 0.495881 | 164.345 |