| Red | Green | Blue | |
| z | 17.64 | ||
| znorm | Inf | ||
| sky | -Inf | -NaN | -Inf |
| S/N | 28.0 | 47.0 | 55.6 |
| S/N(c) | 0.0 | 0.0 | 0.0 |
| SN(E/C) |
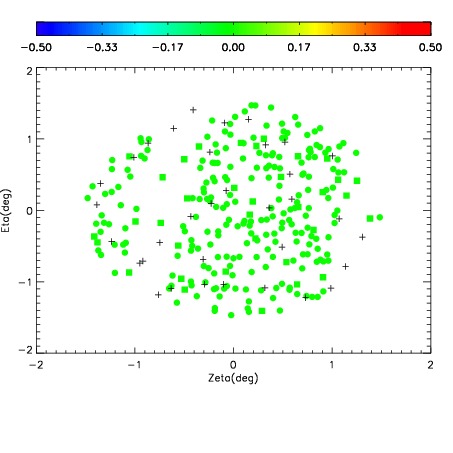

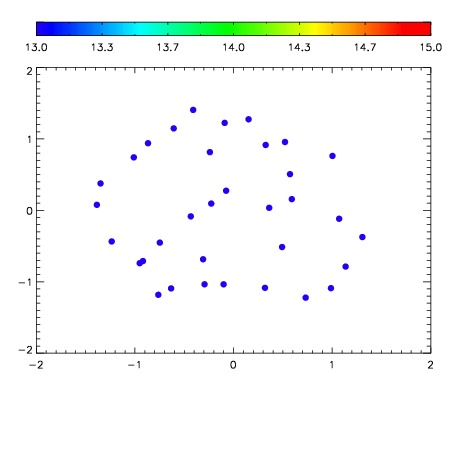

| Frame | Nreads | Zeropoints | Mag plots | Spatial mag deviation | Spatial sky 16325A emission deviations (filled: sky, open: star) | Spatial sky continuum emission | Spatial sky telluric CO2 absorption deviations (filled: H < 10) | |||||||||||||||||||||||
| 0 | 0 |
|
|
|
|
|
|
| IPAIR | NAME | SHIFT | NEWSHIFT | S/N | NAME | SHIFT | NEWSHIFT | S/N |
| 0 | 03710082 | 0.510187 | 0.00000 | 215.958 | 03710079 | 0.00227208 | 0.507915 | 218.699 |
| 1 | 03710078 | 0.506365 | 0.00382197 | 224.180 | 03710080 | 0.00290706 | 0.507280 | 222.898 |
| 2 | 03710081 | 0.508037 | 0.00215000 | 222.287 | 03710076 | 0.00000 | 0.510187 | 220.374 |
| 3 | 03710077 | 0.505477 | 0.00470996 | 219.616 | 03710083 | 0.00423114 | 0.505956 | 219.459 |