| Red | Green | Blue | |
| z | 17.64 | ||
| znorm | Inf | ||
| sky | -Inf | -NaN | -Inf |
| S/N | 19.5 | 35.2 | 40.8 |
| S/N(c) | 0.0 | 0.0 | 0.0 |
| SN(E/C) |
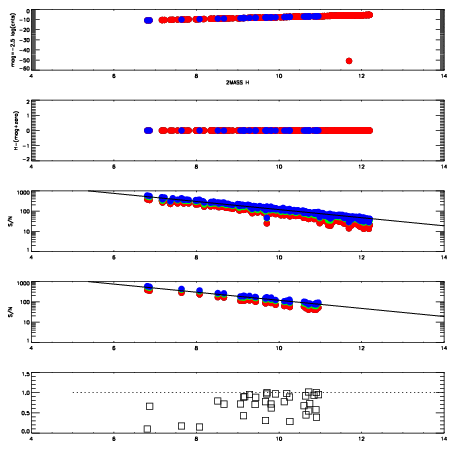
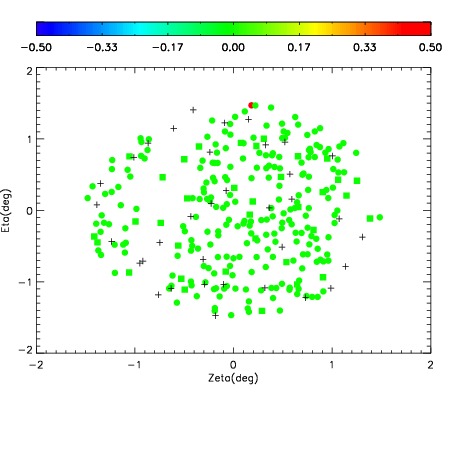
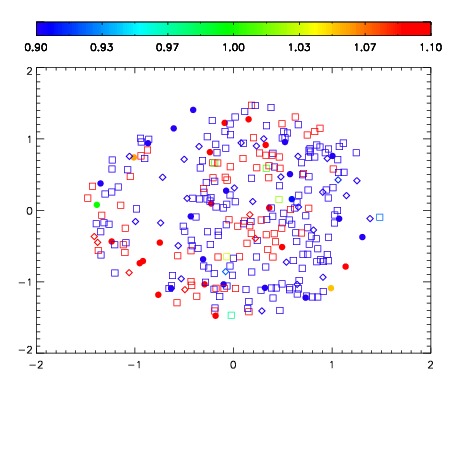
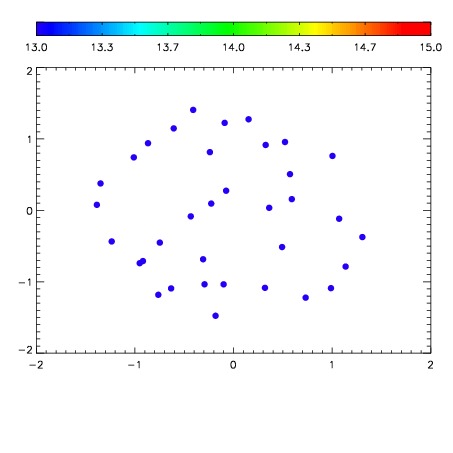

| Frame | Nreads | Zeropoints | Mag plots | Spatial mag deviation | Spatial sky 16325A emission deviations (filled: sky, open: star) | Spatial sky continuum emission | Spatial sky telluric CO2 absorption deviations (filled: H < 10) | |||||||||||||||||||||||
| 0 | 0 |
|
|
|
|
|
|
| IPAIR | NAME | SHIFT | NEWSHIFT | S/N | NAME | SHIFT | NEWSHIFT | S/N |
| 0 | 03780042 | 0.508201 | 0.00000 | 177.938 | 03780036 | 0.00000 | 0.508201 | 165.254 |
| 1 | 03780037 | 0.504783 | 0.00341803 | 180.064 | 03780039 | 0.00237717 | 0.505824 | 173.440 |
| 2 | 03780038 | 0.506064 | 0.00213701 | 176.085 | 03780043 | 0.00234786 | 0.505853 | 156.544 |
| 3 | 03780041 | 0.507555 | 0.000645995 | 166.834 | 03780040 | 0.00323123 | 0.504970 | 155.768 |