| Red | Green | Blue | |
| z | 17.64 | ||
| znorm | Inf | ||
| sky | -Inf | -Inf | -Inf |
| S/N | 19.8 | 34.4 | 41.4 |
| S/N(c) | 0.0 | 0.0 | 0.0 |
| SN(E/C) |
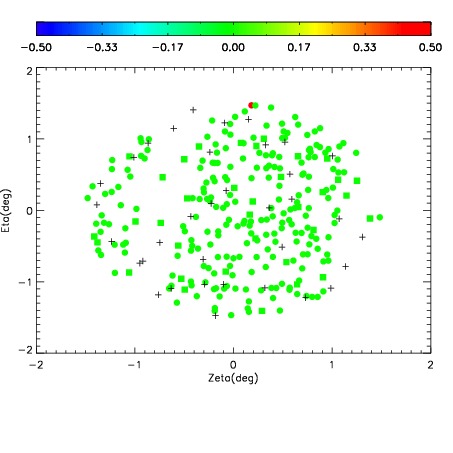
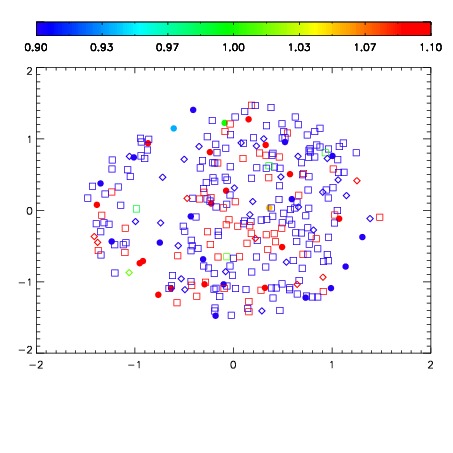
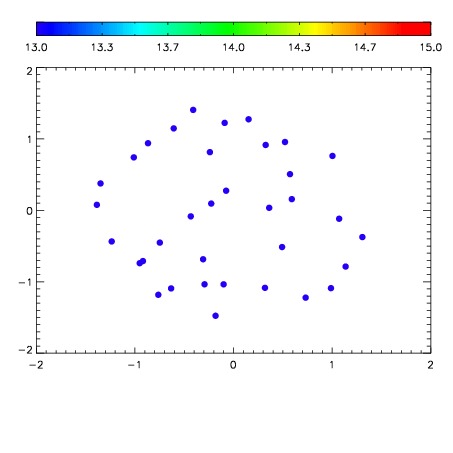

| Frame | Nreads | Zeropoints | Mag plots | Spatial mag deviation | Spatial sky 16325A emission deviations (filled: sky, open: star) | Spatial sky continuum emission | Spatial sky telluric CO2 absorption deviations (filled: H < 10) | |||||||||||||||||||||||
| 0 | 0 |
|
|
|
|
|
|
| IPAIR | NAME | SHIFT | NEWSHIFT | S/N | NAME | SHIFT | NEWSHIFT | S/N |
| 0 | 04010047 | 0.490660 | 0.00000 | 176.211 | 04010048 | -0.000428839 | 0.491089 | 152.756 |
| 1 | 04010046 | 0.488984 | 0.00167602 | 186.073 | 04010052 | -0.00141690 | 0.492077 | 190.844 |
| 2 | 04010051 | 0.487627 | 0.00303301 | 182.088 | 04010045 | 0.00000 | 0.490660 | 169.062 |
| 3 | 04010050 | 0.487380 | 0.00328001 | 159.257 | 04010049 | -0.00146207 | 0.492122 | 138.429 |