| Red | Green | Blue | |
| z | 17.64 | ||
| znorm | Inf | ||
| sky | -Inf | -Inf | -Inf |
| S/N | 29.0 | 48.4 | 56.7 |
| S/N(c) | 0.0 | 0.0 | 0.0 |
| SN(E/C) |
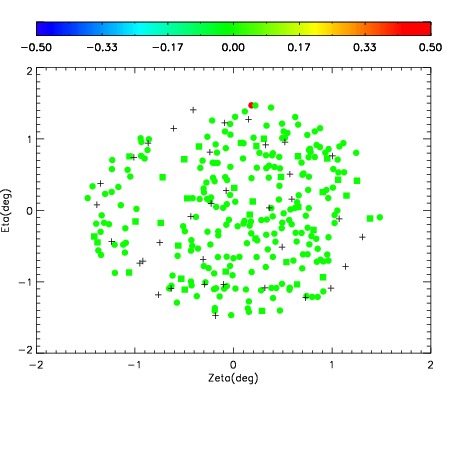
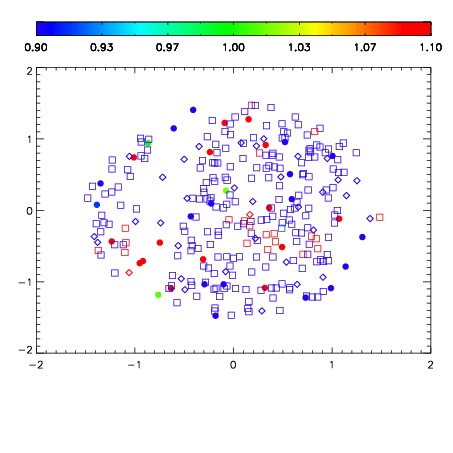
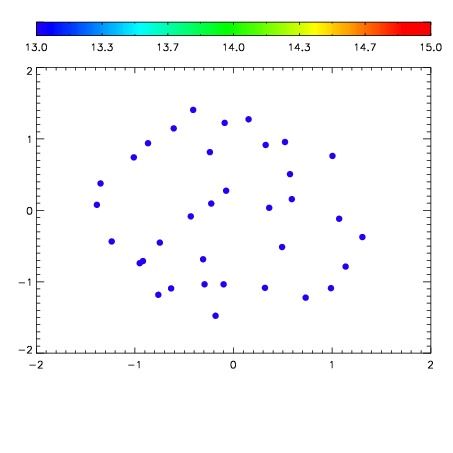

| Frame | Nreads | Zeropoints | Mag plots | Spatial mag deviation | Spatial sky 16325A emission deviations (filled: sky, open: star) | Spatial sky continuum emission | Spatial sky telluric CO2 absorption deviations (filled: H < 10) | |||||||||||||||||||||||
| 0 | 0 |
|
|
|
|
|
|
| IPAIR | NAME | SHIFT | NEWSHIFT | S/N | NAME | SHIFT | NEWSHIFT | S/N |
| 0 | 04040053 | 0.495858 | 0.00000 | 221.360 | 04040054 | -0.00174952 | 0.497608 | 225.818 |
| 1 | 04040052 | 0.495399 | 0.000459015 | 219.562 | 04040051 | -0.00157661 | 0.497435 | 220.498 |
| 2 | 04040049 | 0.493136 | 0.00272202 | 212.857 | 04040050 | -0.000189429 | 0.496047 | 216.200 |
| 3 | 04040048 | 0.493269 | 0.00258902 | 207.697 | 04040047 | 0.00000 | 0.495858 | 191.263 |