| Red | Green | Blue | |
| z | 17.64 | ||
| znorm | Inf | ||
| sky | -Inf | -Inf | -Inf |
| S/N | 20.3 | 36.4 | 43.3 |
| S/N(c) | 0.0 | 0.0 | 0.0 |
| SN(E/C) |
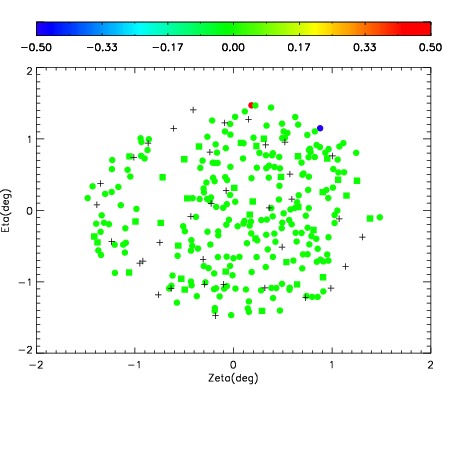
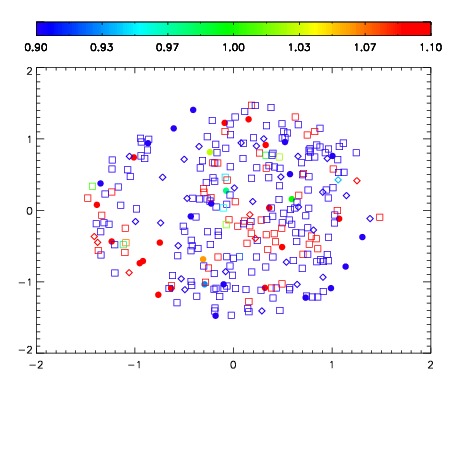
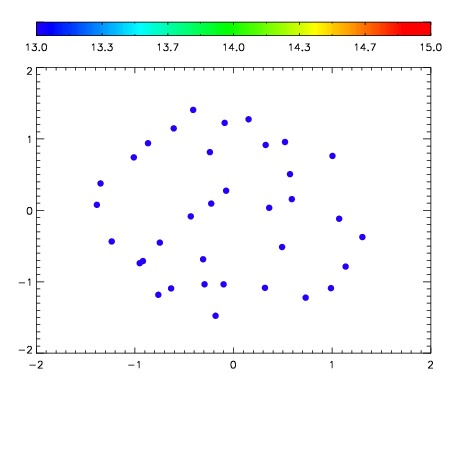

| Frame | Nreads | Zeropoints | Mag plots | Spatial mag deviation | Spatial sky 16325A emission deviations (filled: sky, open: star) | Spatial sky continuum emission | Spatial sky telluric CO2 absorption deviations (filled: H < 10) | |||||||||||||||||||||||
| 0 | 0 |
|
|
|
|
|
|
| IPAIR | NAME | SHIFT | NEWSHIFT | S/N | NAME | SHIFT | NEWSHIFT | S/N |
| 0 | 04050053 | 0.492633 | 0.00000 | 197.726 | 04050054 | -0.00151197 | 0.494145 | 180.065 |
| 1 | 04050052 | 0.491598 | 0.00103498 | 182.016 | 04050050 | 0.000788454 | 0.491845 | 173.794 |
| 2 | 04050049 | 0.491601 | 0.00103199 | 177.803 | 04050051 | -0.00220344 | 0.494836 | 167.976 |
| 3 | 04050048 | 0.490711 | 0.00192198 | 173.353 | 04050047 | 0.00000 | 0.492633 | 161.767 |