| Red | Green | Blue | |
| z | 17.64 | ||
| znorm | Inf | ||
| sky | -Inf | -Inf | -Inf |
| S/N | 28.5 | 47.6 | 54.6 |
| S/N(c) | 0.0 | 0.0 | 0.0 |
| SN(E/C) |
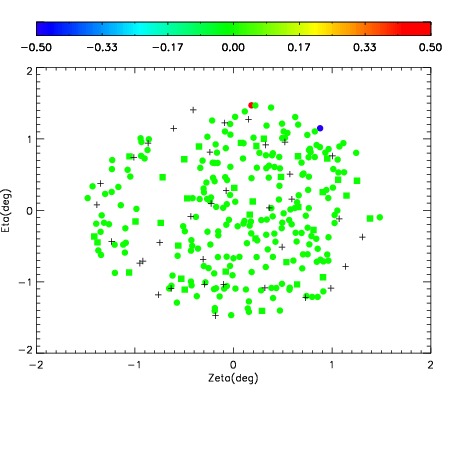
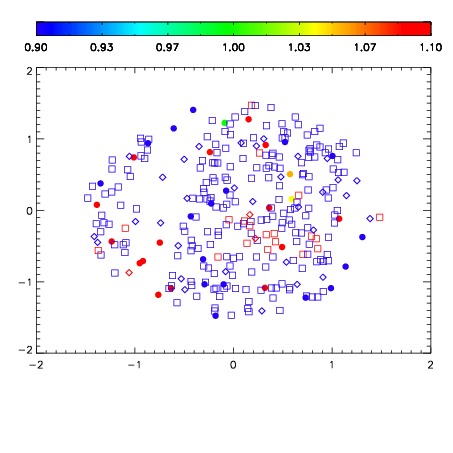
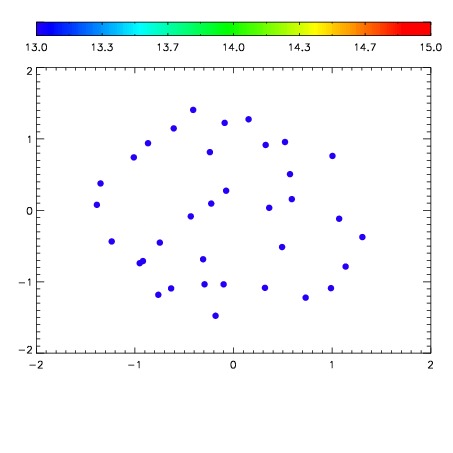

| Frame | Nreads | Zeropoints | Mag plots | Spatial mag deviation | Spatial sky 16325A emission deviations (filled: sky, open: star) | Spatial sky continuum emission | Spatial sky telluric CO2 absorption deviations (filled: H < 10) | |||||||||||||||||||||||
| 0 | 0 |
|
|
|
|
|
|
| IPAIR | NAME | SHIFT | NEWSHIFT | S/N | NAME | SHIFT | NEWSHIFT | S/N |
| 0 | 04060031 | 0.494702 | 0.00000 | 220.284 | 04060030 | -0.00115510 | 0.495857 | 221.482 |
| 1 | 04060028 | 0.493766 | 0.000936002 | 221.131 | 04060033 | 0.000839776 | 0.493862 | 222.835 |
| 2 | 04060032 | 0.494239 | 0.000463009 | 218.663 | 04060029 | 0.000501621 | 0.494200 | 221.091 |
| 3 | 04060027 | 0.493063 | 0.00163901 | 214.386 | 04060026 | 0.00000 | 0.494702 | 211.035 |