| Red | Green | Blue | |
| z | 17.64 | ||
| znorm | Inf | ||
| sky | -Inf | -Inf | -Inf |
| S/N | 22.9 | 41.2 | 43.9 |
| S/N(c) | 0.0 | 0.0 | 0.0 |
| SN(E/C) |
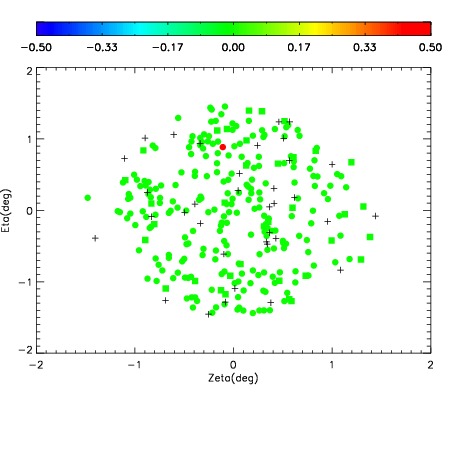
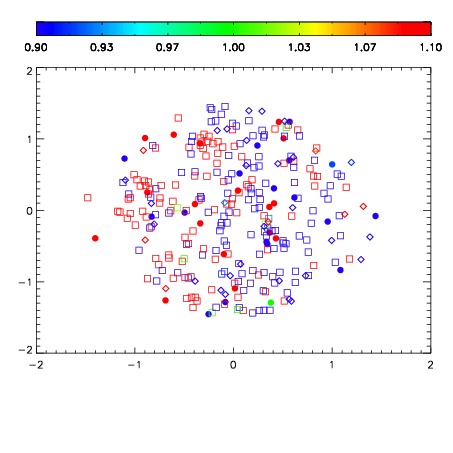
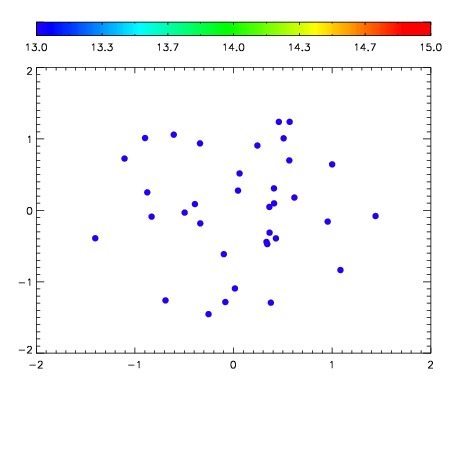

| Frame | Nreads | Zeropoints | Mag plots | Spatial mag deviation | Spatial sky 16325A emission deviations (filled: sky, open: star) | Spatial sky continuum emission | Spatial sky telluric CO2 absorption deviations (filled: H < 10) | |||||||||||||||||||||||
| 0 | 0 |
|
|
|
|
|
|
| IPAIR | NAME | SHIFT | NEWSHIFT | S/N | NAME | SHIFT | NEWSHIFT | S/N |
| 0 | 03740025 | 0.500073 | 0.00000 | 193.774 | 03740026 | 0.000246128 | 0.499827 | 188.629 |
| 1 | 03740024 | 0.497814 | 0.00225902 | 196.967 | 03740027 | 0.000121009 | 0.499952 | 197.782 |
| 2 | 03740028 | 0.494895 | 0.00517800 | 196.407 | 03740030 | 0.00221580 | 0.497857 | 188.845 |
| 3 | 03740029 | 0.496284 | 0.00378901 | 193.200 | 03740023 | 0.00000 | 0.500073 | 186.405 |