| Red | Green | Blue | |
| z | 17.64 | ||
| znorm | Inf | ||
| sky | -Inf | -Inf | -Inf |
| S/N | 28.5 | 50.2 | 54.8 |
| S/N(c) | 0.0 | 0.0 | 0.0 |
| SN(E/C) |
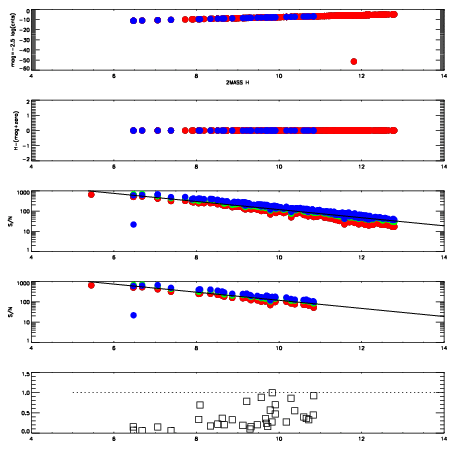
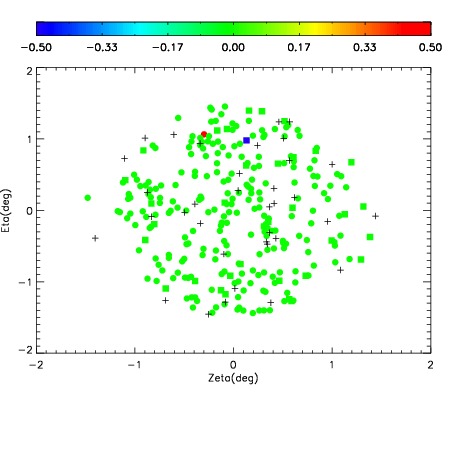
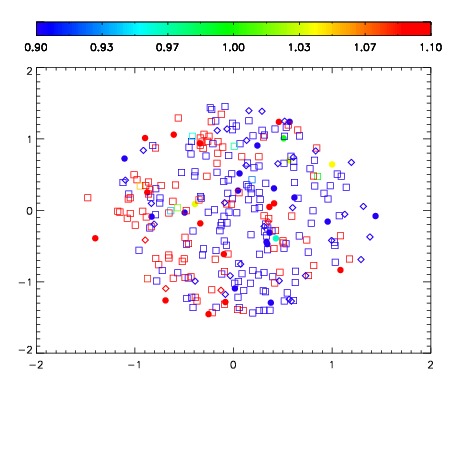
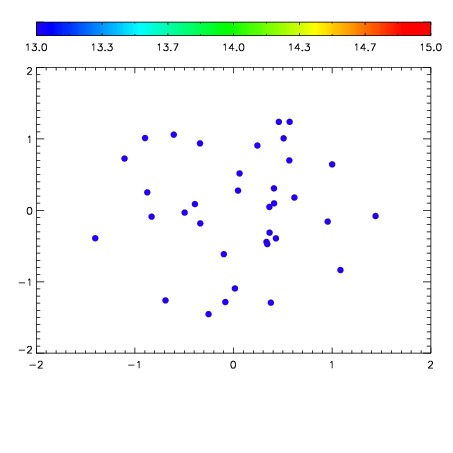

| Frame | Nreads | Zeropoints | Mag plots | Spatial mag deviation | Spatial sky 16325A emission deviations (filled: sky, open: star) | Spatial sky continuum emission | Spatial sky telluric CO2 absorption deviations (filled: H < 10) | |||||||||||||||||||||||
| 0 | 0 |
|
|
|
|
|
|
| IPAIR | NAME | SHIFT | NEWSHIFT | S/N | NAME | SHIFT | NEWSHIFT | S/N |
| 0 | 04280036 | 0.496146 | 0.00000 | 226.165 | 04280037 | 4.96642e-05 | 0.496096 | 226.905 |
| 1 | 04280035 | 0.490503 | 0.00564298 | 228.789 | 04280034 | -0.000744707 | 0.496891 | 227.247 |
| 2 | 04280032 | 0.494618 | 0.00152799 | 221.721 | 04280033 | 0.00145300 | 0.494693 | 226.714 |
| 3 | 04280031 | 0.490037 | 0.00610900 | 220.198 | 04280030 | 0.00000 | 0.496146 | 218.004 |