| Red | Green | Blue | |
| z | 17.64 | ||
| znorm | Inf | ||
| sky | -Inf | -Inf | -Inf |
| S/N | 24.5 | 42.9 | 47.5 |
| S/N(c) | 0.0 | 0.0 | 0.0 |
| SN(E/C) |

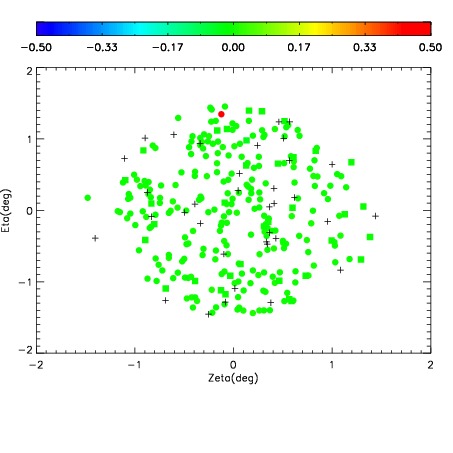
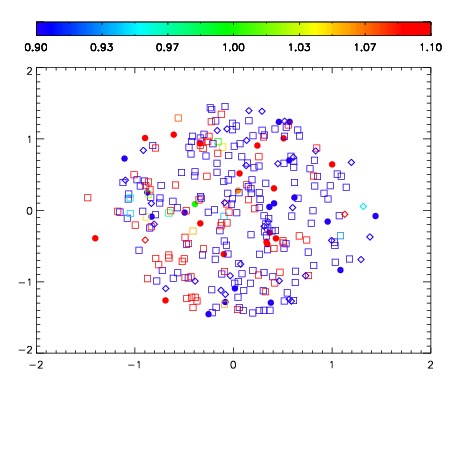


| Frame | Nreads | Zeropoints | Mag plots | Spatial mag deviation | Spatial sky 16325A emission deviations (filled: sky, open: star) | Spatial sky continuum emission | Spatial sky telluric CO2 absorption deviations (filled: H < 10) | |||||||||||||||||||||||
| 0 | 0 |
|
|
|
|
|
|
| IPAIR | NAME | SHIFT | NEWSHIFT | S/N | NAME | SHIFT | NEWSHIFT | S/N |
| 0 | 07830055 | 0.475199 | 0.00000 | 183.549 | 07830052 | -0.00156045 | 0.476759 | 181.769 |
| 1 | 07830054 | 0.474212 | 0.000987023 | 186.472 | 07830053 | -0.000510214 | 0.475709 | 185.918 |
| 2 | 07830051 | 0.469251 | 0.00594801 | 172.601 | 07830056 | 0.00162121 | 0.473578 | 175.083 |
| 3 | 07830050 | 0.469354 | 0.00584501 | 156.513 | 07830049 | 0.00000 | 0.475199 | 147.522 |