| Red | Green | Blue | |
| z | 17.64 | ||
| znorm | Inf | ||
| sky | -Inf | -NaN | -Inf |
| S/N | 29.3 | 51.3 | 57.8 |
| S/N(c) | 0.0 | 0.0 | 0.0 |
| SN(E/C) |
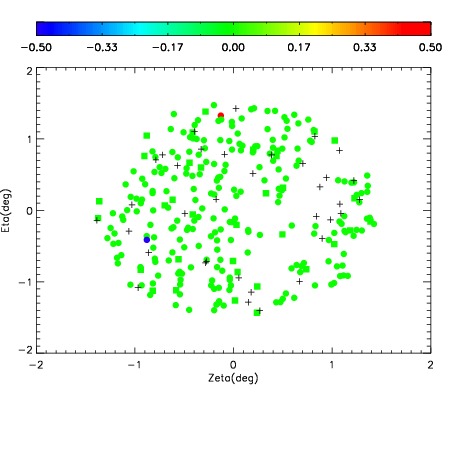

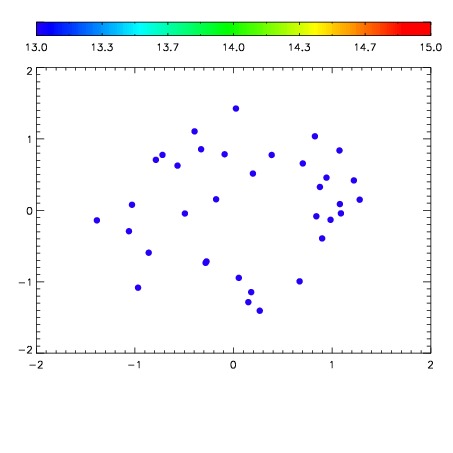

| Frame | Nreads | Zeropoints | Mag plots | Spatial mag deviation | Spatial sky 16325A emission deviations (filled: sky, open: star) | Spatial sky continuum emission | Spatial sky telluric CO2 absorption deviations (filled: H < 10) | |||||||||||||||||||||||
| 0 | 0 |
|
|
|
|
|
|
| IPAIR | NAME | SHIFT | NEWSHIFT | S/N | NAME | SHIFT | NEWSHIFT | S/N |
| 0 | 03750083 | 0.508983 | 0.00000 | 186.629 | 03750084 | 0.00225881 | 0.506724 | 191.038 |
| 1 | 03750087 | 0.506504 | 0.00247902 | 194.733 | 03750088 | 0.00371279 | 0.505270 | 197.640 |
| 2 | 03750086 | 0.503939 | 0.00504404 | 190.890 | 03750085 | 0.00582212 | 0.503161 | 191.831 |
| 3 | 03750082 | 0.500763 | 0.00822002 | 180.924 | 03750081 | 0.000840440 | 0.508143 | 177.477 |
| 4 | 03750078 | 0.500710 | 0.00827301 | 164.795 | 03750080 | 0.00160709 | 0.507376 | 173.527 |