| Red | Green | Blue | |
| z | 17.64 | ||
| znorm | Inf | ||
| sky | -Inf | -Inf | -Inf |
| S/N | 22.0 | 40.3 | 45.7 |
| S/N(c) | 0.0 | 0.0 | 0.0 |
| SN(E/C) |
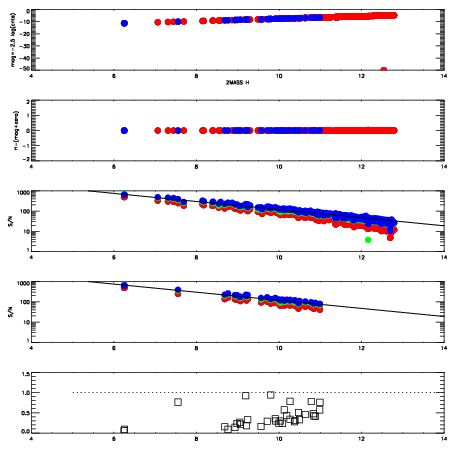
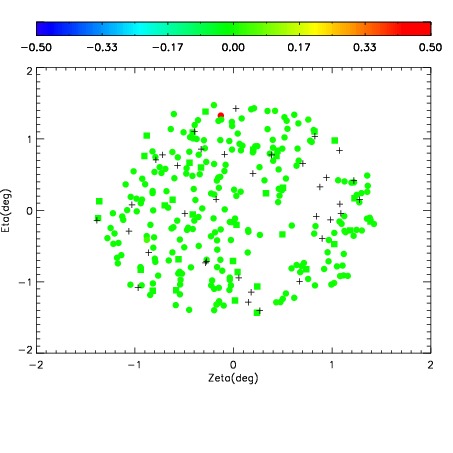
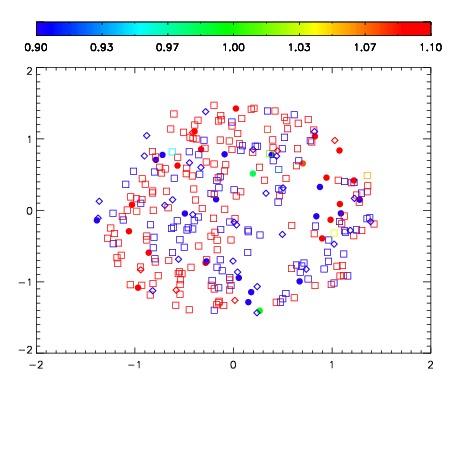
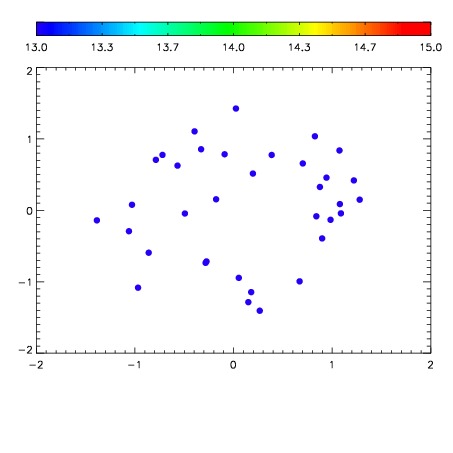

| Frame | Nreads | Zeropoints | Mag plots | Spatial mag deviation | Spatial sky 16325A emission deviations (filled: sky, open: star) | Spatial sky continuum emission | Spatial sky telluric CO2 absorption deviations (filled: H < 10) | |||||||||||||||||||||||
| 0 | 0 |
|
|
|
|
|
|
| IPAIR | NAME | SHIFT | NEWSHIFT | S/N | NAME | SHIFT | NEWSHIFT | S/N |
| 0 | 04010058 | 0.492623 | 0.00000 | 161.231 | 04010059 | -0.00130926 | 0.493932 | 177.392 |
| 1 | 04010062 | 0.492485 | 0.000138015 | 185.491 | 04010063 | -0.000261961 | 0.492885 | 198.105 |
| 2 | 04010061 | 0.490780 | 0.00184301 | 177.330 | 04010060 | -0.00175820 | 0.494381 | 195.024 |
| 3 | 04010057 | 0.491931 | 0.000692010 | 159.572 | 04010056 | 0.00000 | 0.492623 | 160.188 |