| Red | Green | Blue | |
| z | 17.64 | ||
| znorm | Inf | ||
| sky | -Inf | -Inf | -Inf |
| S/N | 22.9 | 38.3 | 45.2 |
| S/N(c) | 0.0 | 0.0 | 0.0 |
| SN(E/C) |
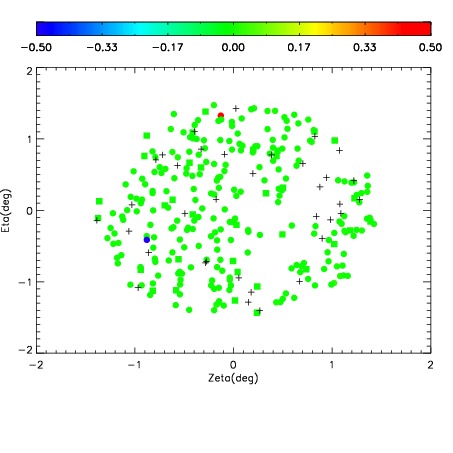
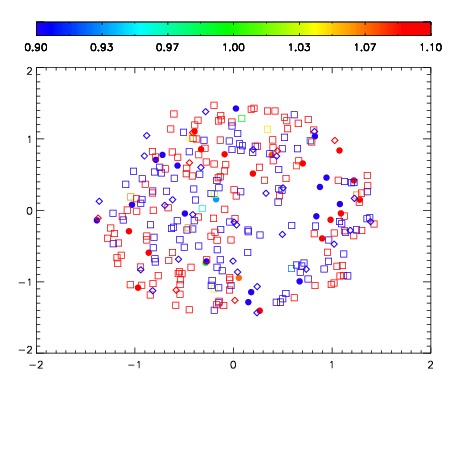
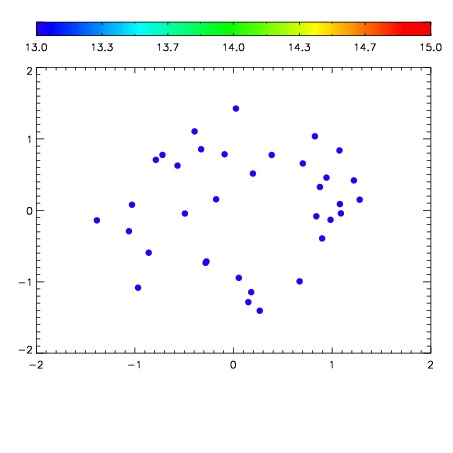

| Frame | Nreads | Zeropoints | Mag plots | Spatial mag deviation | Spatial sky 16325A emission deviations (filled: sky, open: star) | Spatial sky continuum emission | Spatial sky telluric CO2 absorption deviations (filled: H < 10) | |||||||||||||||||||||||
| 0 | 0 |
|
|
|
|
|
|
| IPAIR | NAME | SHIFT | NEWSHIFT | S/N | NAME | SHIFT | NEWSHIFT | S/N |
| 0 | 04290040 | 0.506564 | 0.00000 | 186.589 | 04290038 | 0.00146358 | 0.505100 | 178.551 |
| 1 | 04290039 | 0.505362 | 0.00120205 | 187.572 | 04290037 | -0.000834733 | 0.507399 | 180.724 |
| 2 | 04290035 | 0.504173 | 0.00239104 | 176.114 | 04290034 | 0.00000 | 0.506564 | 175.414 |