| Red | Green | Blue | |
| z | 17.64 | ||
| znorm | Inf | ||
| sky | -NaN | -Inf | -Inf |
| S/N | 34.8 | 61.6 | 65.8 |
| S/N(c) | 0.0 | 0.0 | 0.0 |
| SN(E/C) |
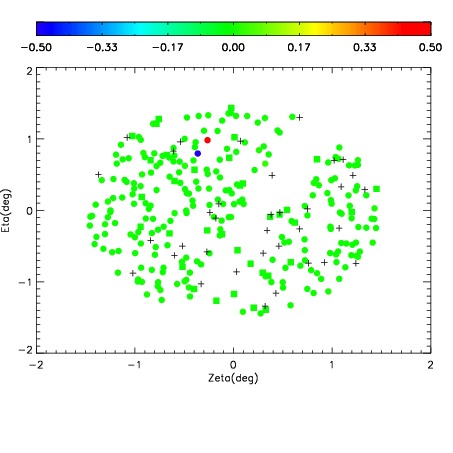
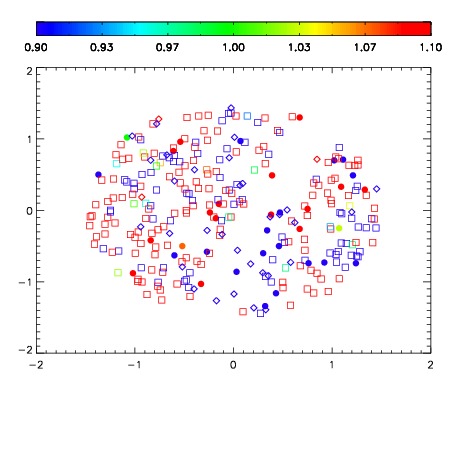
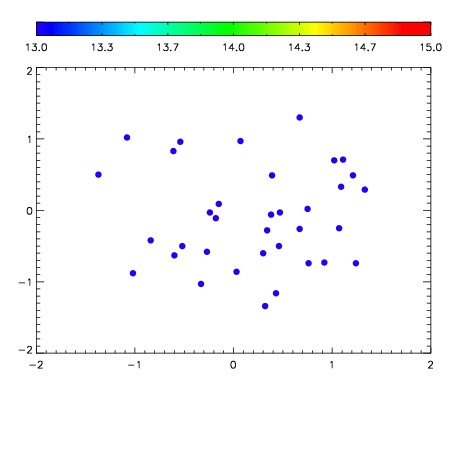

| Frame | Nreads | Zeropoints | Mag plots | Spatial mag deviation | Spatial sky 16325A emission deviations (filled: sky, open: star) | Spatial sky continuum emission | Spatial sky telluric CO2 absorption deviations (filled: H < 10) | |||||||||||||||||||||||
| 0 | 0 |
|
|
|
|
|
|
| IPAIR | NAME | SHIFT | NEWSHIFT | S/N | NAME | SHIFT | NEWSHIFT | S/N |
| 0 | 10950021 | 0.502245 | 0.00000 | 154.055 | 10950022 | 0.000955381 | 0.501290 | 160.665 |
| 1 | 10950024 | 0.500660 | 0.00158501 | 161.132 | 10950023 | 0.00137754 | 0.500867 | 163.830 |
| 2 | 10950020 | 0.501423 | 0.000822008 | 152.265 | 10950018 | 0.000768550 | 0.501476 | 148.948 |
| 3 | 10950017 | 0.500611 | 0.00163400 | 149.597 | 10950015 | 0.00131839 | 0.500927 | 148.117 |
| 4 | 10950012 | 0.499442 | 0.00280300 | 145.357 | 10950019 | 0.00131449 | 0.500931 | 147.723 |
| 5 | 10950016 | 0.500276 | 0.00196898 | 144.337 | 10950014 | 0.00104890 | 0.501196 | 143.558 |
| 6 | 10950013 | 0.499257 | 0.00298801 | 143.356 | 10950011 | 0.00000 | 0.502245 | 134.491 |