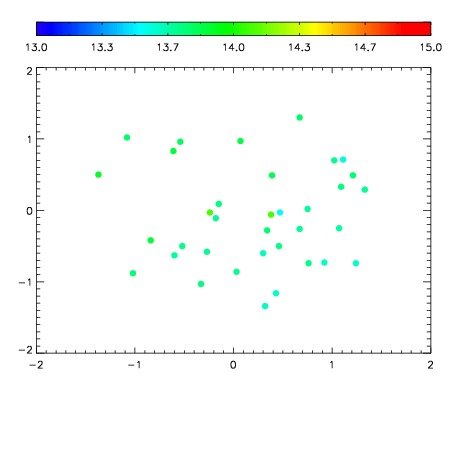
| Frame | Nreads | Zeropoints | Mag plots
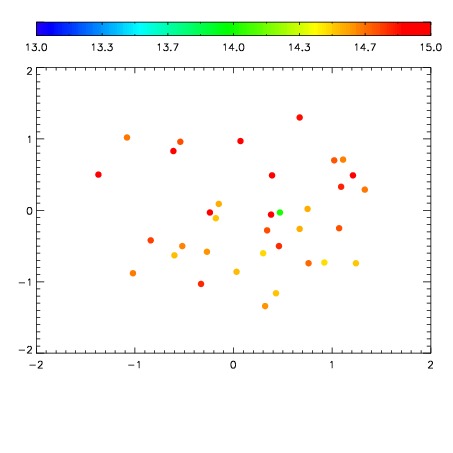
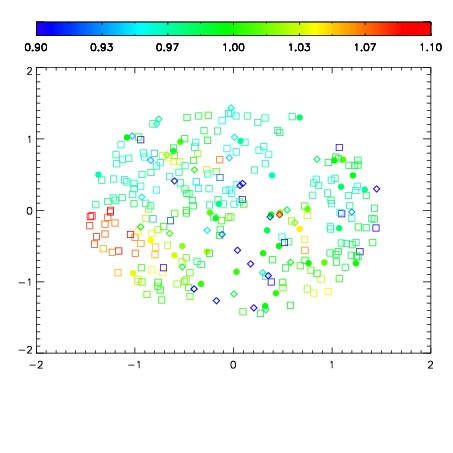
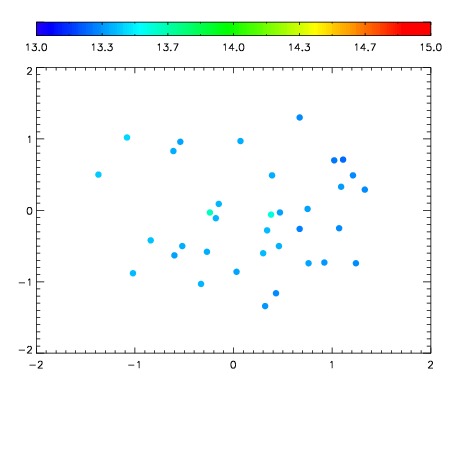
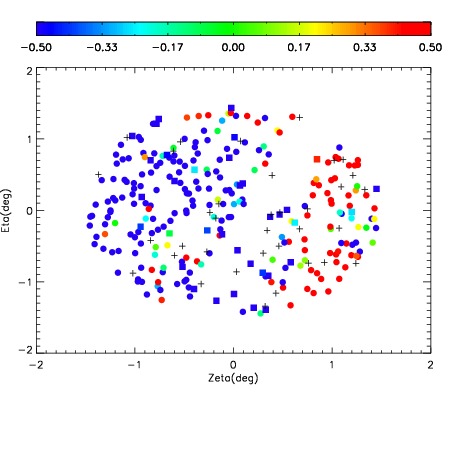
| Spatial mag deviation
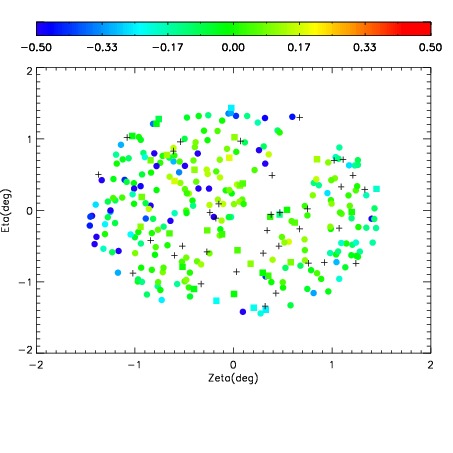
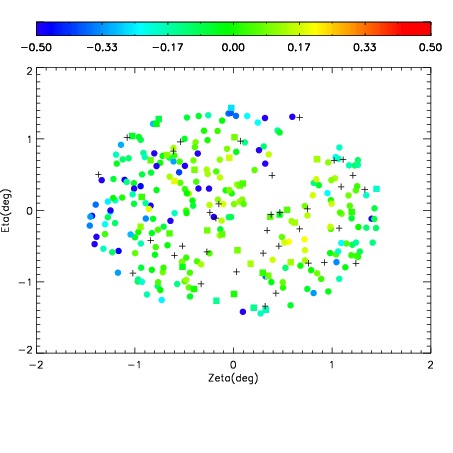
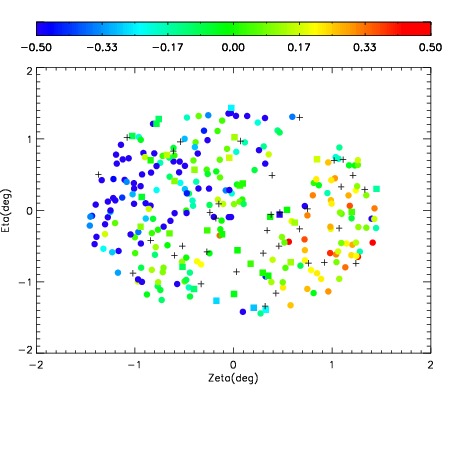
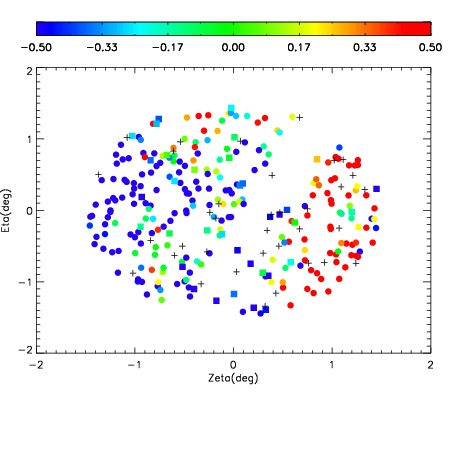
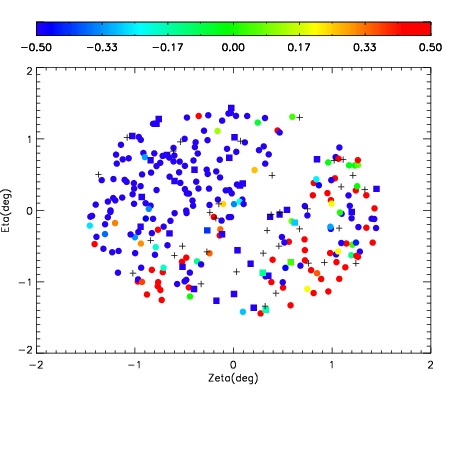
| Spatial sky 16325A emission deviations (filled: sky, open: star)
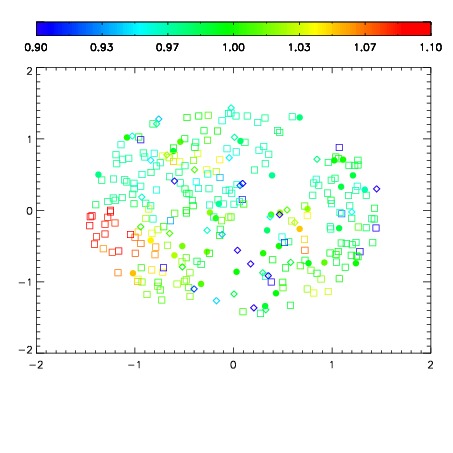
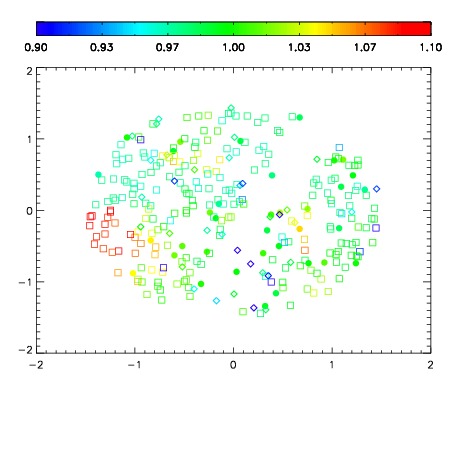
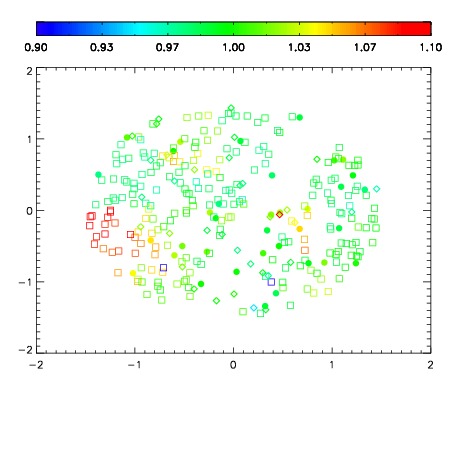
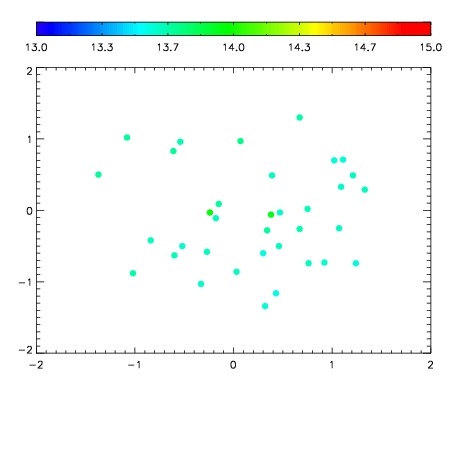
| Spatial sky continuum emission
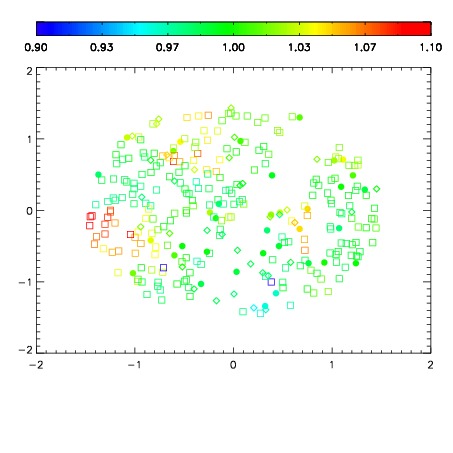
| Spatial sky telluric CO2 absorption deviations (filled: H < 10)
|
| 11170078
| 47
| | Red | Green | Blue
| | z | | 18.81
| | znorm | | 14.63
| | sky | 15.1 | 14.7 | 14.5
| | S/N | 12.4 | 21.3 | 23.7
| | S/N(c) | 11.1 | 19.8 | 22.4
| | SN(E/C) 0.31
|
| 
| 
| 
| 
| 
|
| 11170079
| 47
| | Red | Green | Blue
| | z | | 18.81
| | znorm | | 14.63
| | sky | 14.6 | 14.2 | 14.4
| | S/N | 12.4 | 20.6 | 23.9
| | S/N(c) | 10.9 | 19.0 | 22.5
| | SN(E/C) 0.29
|
| 
| 
| 
| 
| 
|
| 11170080
| 47
| | Red | Green | Blue
| | z | | 18.47
| | znorm | | 14.29
| | sky | 13.9 | 13.7 | 13.8
| | S/N | 9.4 | 15.9 | 18.9
| | S/N(c) | 7.9 | 14.4 | 17.9
| | SN(E/C) 0.38
|
| 
| 
| 
| 
| 
|
| 11170081
| 47
| | Red | Green | Blue
| | z | | 18.05
| | znorm | | 13.87
| | sky | 13.5 | 13.5 | 13.6
| | S/N | 6.7 | 11.8 | 14.0
| | S/N(c) | 5.9 | 10.4 | 12.8
| | SN(E/C) 0.43
|
| 
| 
| 
| 
| 
|
| 11170082
| 47
| | Red | Green | Blue
| | z | | 15.90
| | znorm | | 11.72
| | sky | 13.1 | 13.1 | 13.2
| | S/N | 0.7 | 2.2 | 2.2
| | S/N(c) | 0.7 | 1.8 | 2.3
| | SN(E/C) 0.89
|
| 
| 
| 
| 
| 
|
| 11170083
| 47
| | Red | Green | Blue
| | z | | 14.22
| | znorm | | 10.04
| | sky | 13.4 | 13.4 | 13.6
| | S/N | 0.2 | 0.7 | 0.3
| | S/N(c) | 0.1 | 0.4 | 0.5
| | SN(E/C) 0.83
|
| 
| 
| 
| 
| 
|
| 11170084
| 47
| | Red | Green | Blue
| | z | | 13.63
| | znorm | | 9.45
| | sky | 13.5 | 13.6 | 13.8
| | S/N | 0.1 | 0.3 | 0.3
| | S/N(c) | 0.0 | 0.0 | 0.0
| | SN(E/C) 2.64
|
| 
| 
| 
| 
| 
|
| 11170085
| 47
| | Red | Green | Blue
| | z | | 13.16
| | znorm | | 8.98
| | sky | 13.6 | 13.6 | 14.0
| | S/N | 0.2 | 0.2 | 0.3
| | S/N(c) | 0.0 | 0.0 | 0.0
| | SN(E/C) 4.78
|
| 
| 
| 
| 
| 
|