| Red | Green | Blue | |
| z | 17.64 | ||
| znorm | Inf | ||
| sky | -NaN | -Inf | -Inf |
| S/N | 13.0 | 22.9 | 27.0 |
| S/N(c) | 0.0 | 0.0 | 0.0 |
| SN(E/C) |
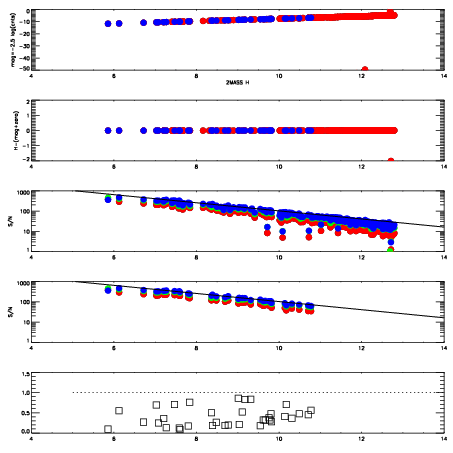

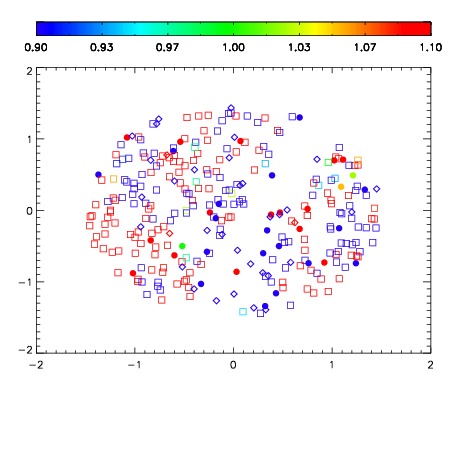
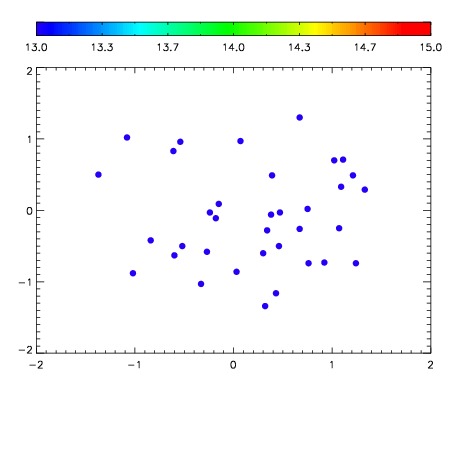

| Frame | Nreads | Zeropoints | Mag plots | Spatial mag deviation | Spatial sky 16325A emission deviations (filled: sky, open: star) | Spatial sky continuum emission | Spatial sky telluric CO2 absorption deviations (filled: H < 10) | |||||||||||||||||||||||
| 0 | 0 |
|
|
|
|
|
|
| IPAIR | NAME | SHIFT | NEWSHIFT | S/N | NAME | SHIFT | NEWSHIFT | S/N |
| 0 | 11170080 | 0.483570 | 0.00000 | 116.504 | 11170081 | -0.00276011 | 0.486330 | 97.4512 |
| 1 | 11170079 | 0.483167 | 0.000403017 | 135.223 | 11170078 | 0.00000 | 0.483570 | 140.687 |
| 2 | 11170083 | 0.481307 | 0.00226301 | 9.64960 | 11170082 | -0.00300773 | 0.486578 | 31.3553 |