| Red | Green | Blue | |
| z | 17.64 | ||
| znorm | Inf | ||
| sky | -Inf | -Inf | -Inf |
| S/N | 29.0 | 49.8 | 54.7 |
| S/N(c) | 0.0 | 0.0 | 0.0 |
| SN(E/C) |
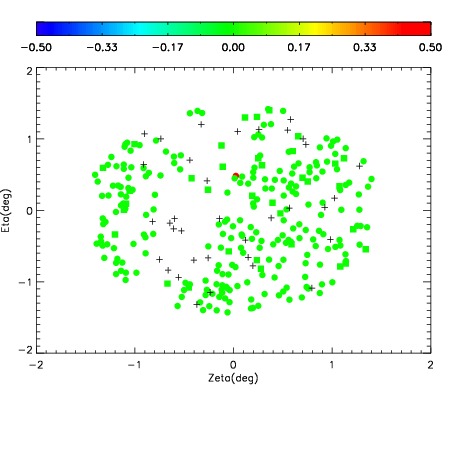
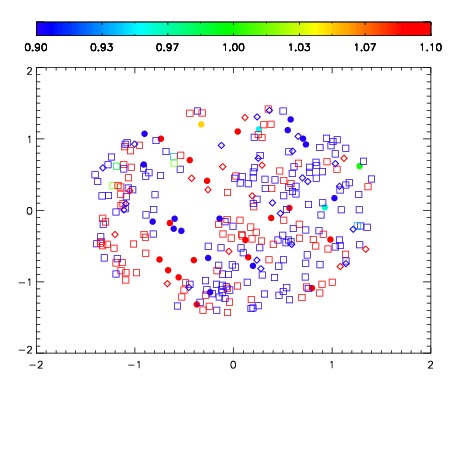
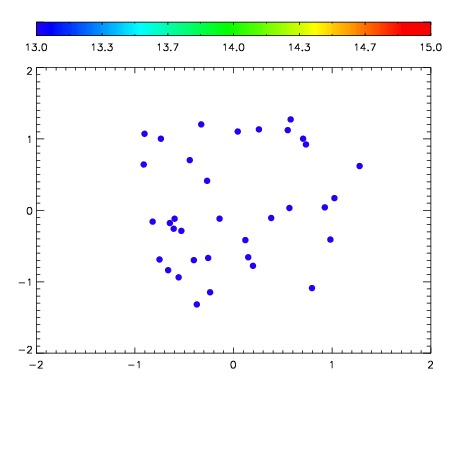

| Frame | Nreads | Zeropoints | Mag plots | Spatial mag deviation | Spatial sky 16325A emission deviations (filled: sky, open: star) | Spatial sky continuum emission | Spatial sky telluric CO2 absorption deviations (filled: H < 10) | |||||||||||||||||||||||
| 0 | 0 |
|
|
|
|
|
|
| IPAIR | NAME | SHIFT | NEWSHIFT | S/N | NAME | SHIFT | NEWSHIFT | S/N |
| 0 | 04560027 | 0.495657 | 0.00000 | 216.916 | 04560028 | -0.00495154 | 0.500609 | 222.250 |
| 1 | 04560031 | 0.492381 | 0.00327599 | 229.956 | 04560032 | -0.00236127 | 0.498018 | 232.028 |
| 2 | 04560030 | 0.492436 | 0.00322101 | 227.863 | 04560029 | -0.00598681 | 0.501644 | 225.941 |
| 3 | 04560026 | 0.495352 | 0.000304997 | 208.318 | 04560025 | 0.00000 | 0.495657 | 203.533 |