| Frame | Nreads | Zeropoints | Mag plots
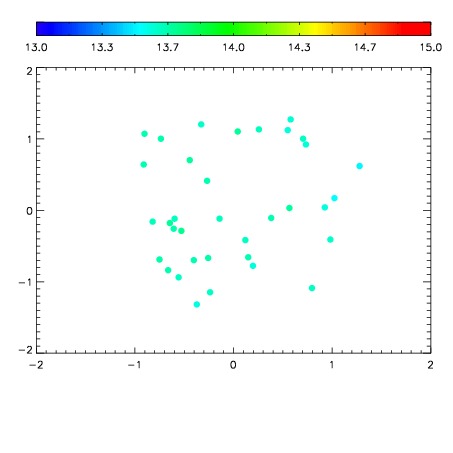
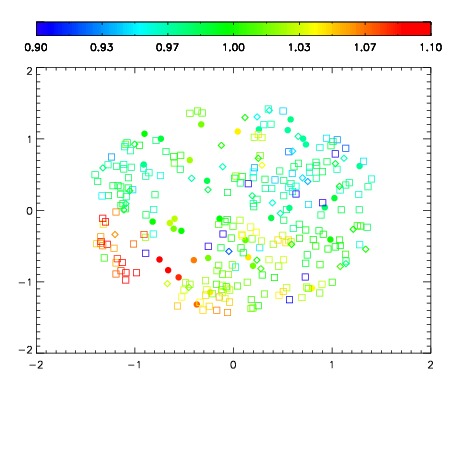
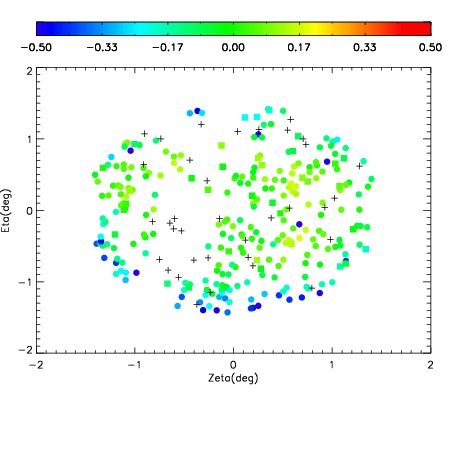
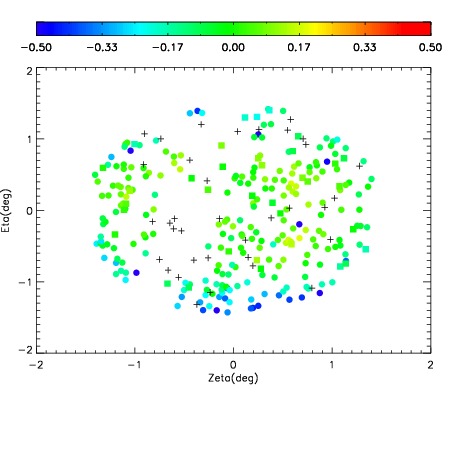
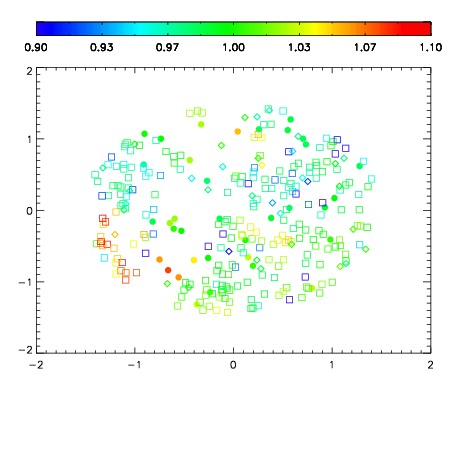
| Spatial mag deviation
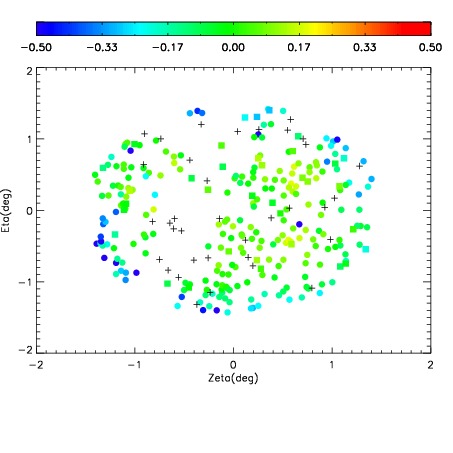
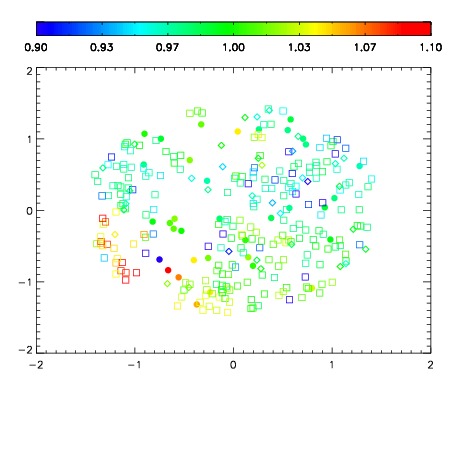
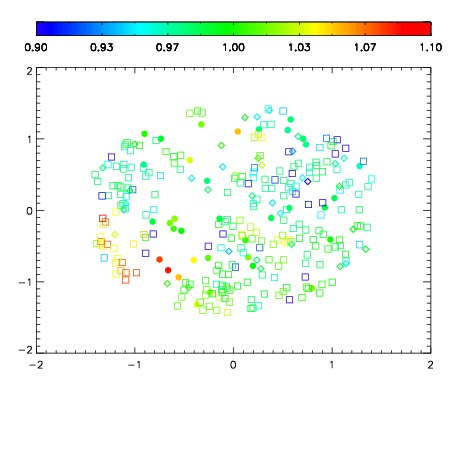
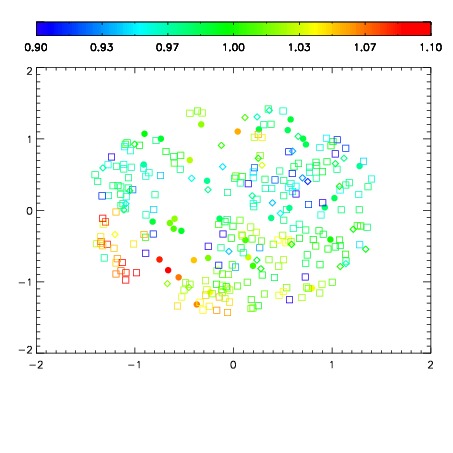
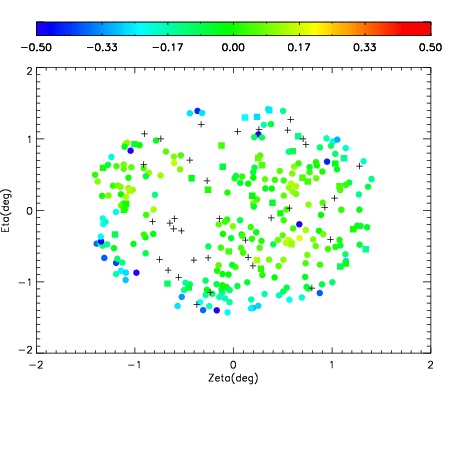
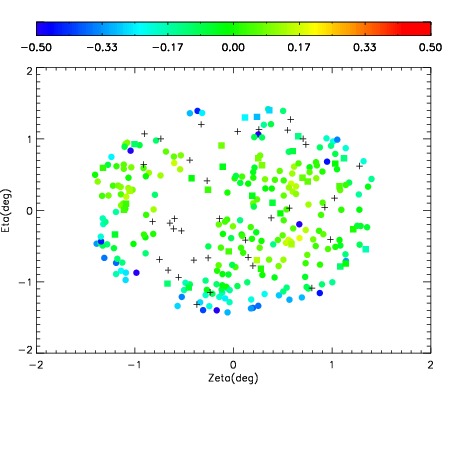
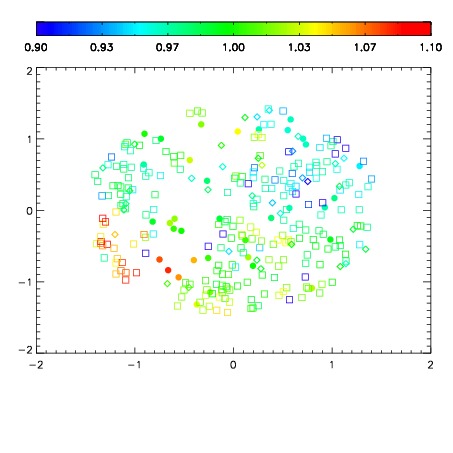
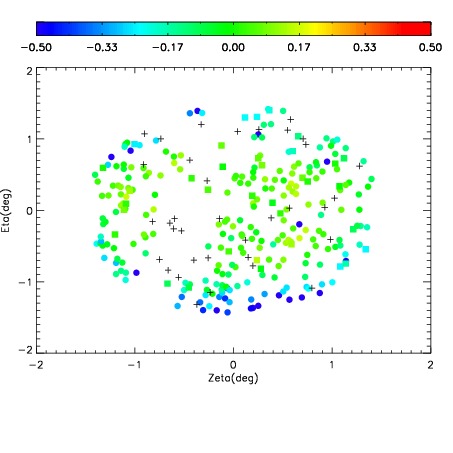
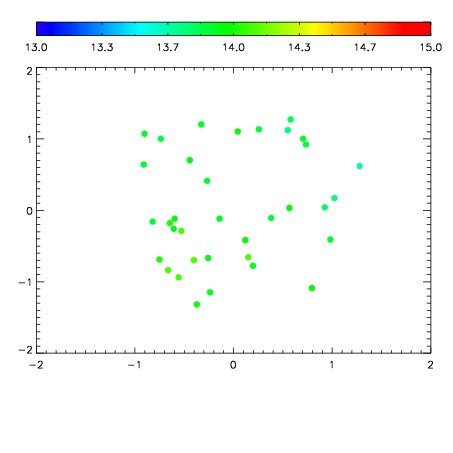
| Spatial sky 16325A emission deviations (filled: sky, open: star)
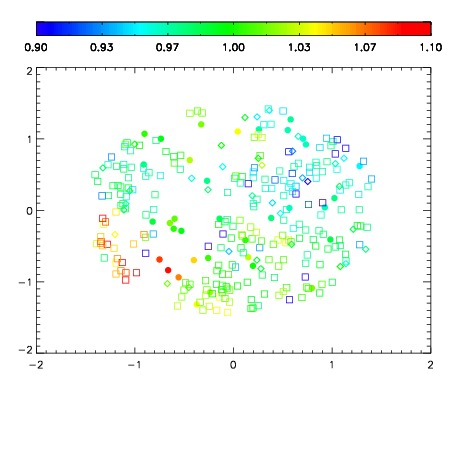
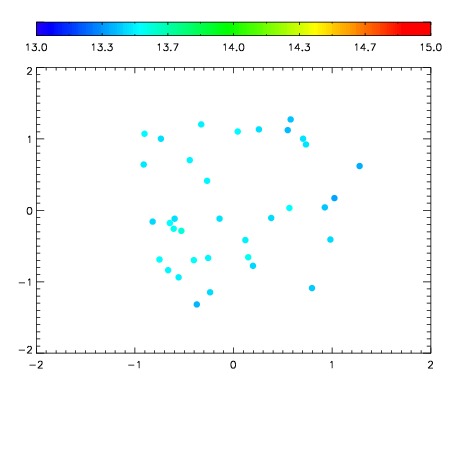
| Spatial sky continuum emission
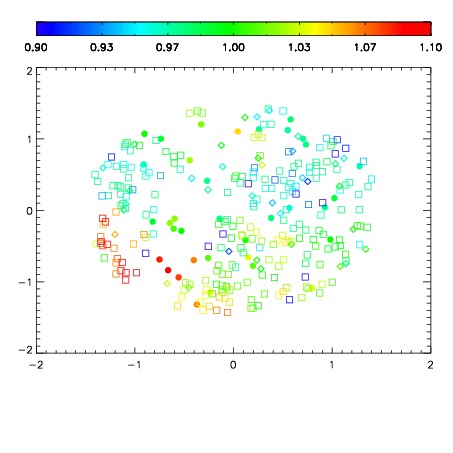
| Spatial sky telluric CO2 absorption deviations (filled: H < 10)
|
| 7040059
| 47
| | Red | Green | Blue
| | z | | 18.48
| | znorm | | 14.30
| | sky | 14.0 | 13.8 | 13.8
| | S/N | 9.8 | 16.3 | 18.5
| | S/N(c) | 8.4 | 14.8 | 17.2
| | SN(E/C) 0.86
|
| 
| 
| 
| 
| 
|
| 7040060
| 47
| | Red | Green | Blue
| | z | | 18.66
| | znorm | | 14.48
| | sky | 13.8 | 13.6 | 13.7
| | S/N | 11.0 | 18.3 | 20.8
| | S/N(c) | 9.4 | 16.6 | 19.3
| | SN(E/C) 0.83
|
| 
| 
| 
| 
| 
|
| 7040061
| 47
| | Red | Green | Blue
| | z | | 18.50
| | znorm | | 14.32
| | sky | 13.8 | 13.6 | 13.6
| | S/N | 9.7 | 16.3 | 18.7
| | S/N(c) | 8.2 | 14.8 | 17.6
| | SN(E/C) 0.85
|
| 
| 
| 
| 
| 
|
| 7040062
| 47
| | Red | Green | Blue
| | z | | 18.14
| | znorm | | 13.95
| | sky | 13.8 | 13.6 | 13.7
| | S/N | 7.4 | 12.9 | 15.0
| | S/N(c) | 6.3 | 11.8 | 13.8
| | SN(E/C) 0.89
|
| 
| 
| 
| 
| 
|
| 7040063
| 47
| | Red | Green | Blue
| | z | | 18.19
| | znorm | | 14.01
| | sky | 13.9 | 13.7 | 13.8
| | S/N | 7.6 | 13.1 | 15.6
| | S/N(c) | 6.5 | 12.2 | 14.3
| | SN(E/C) 0.90
|
| 
| 
| 
| 
| 
|
| 7040064
| 47
| | Red | Green | Blue
| | z | | 18.34
| | znorm | | 14.16
| | sky | 13.8 | 13.6 | 13.7
| | S/N | 8.7 | 14.9 | 17.4
| | S/N(c) | 7.4 | 13.6 | 15.8
| | SN(E/C) 0.85
|
| 
| 
| 
| 
| 
|
| 7040065
| 47
| | Red | Green | Blue
| | z | | 18.30
| | znorm | | 14.12
| | sky | 13.6 | 13.5 | 13.5
| | S/N | 8.4 | 14.4 | 16.4
| | S/N(c) | 7.0 | 13.0 | 15.2
| | SN(E/C) 0.86
|
| 
| 
| 
| 
| 
|
| 7040066
| 47
| | Red | Green | Blue
| | z | | 18.32
| | znorm | | 14.14
| | sky | 13.8 | 13.7 | 13.8
| | S/N | 8.7 | 14.8 | 16.8
| | S/N(c) | 7.3 | 13.7 | 15.6
| | SN(E/C) 0.88
|
| 
| 
| 
| 
| 
|
| 7040067
| 47
| | Red | Green | Blue
| | z | | 18.61
| | znorm | | 14.43
| | sky | 14.0 | 13.8 | 14.0
| | S/N | 10.5 | 18.2 | 20.2
| | S/N(c) | 9.0 | 16.6 | 18.9
| | SN(E/C) 0.84
|
| 
| 
| 
| 
| 
|
| 7040068
| 47
| | Red | Green | Blue
| | z | | 18.54
| | znorm | | 14.36
| | sky | 14.0 | 13.9 | 14.0
| | S/N | 10.6 | 17.7 | 19.5
| | S/N(c) | 9.0 | 16.4 | 18.1
| | SN(E/C) 0.85
|
| 
| 
| 
| 
| 
|