| Red | Green | Blue | |
| z | 17.64 | ||
| znorm | Inf | ||
| sky | -Inf | -Inf | -Inf |
| S/N | 17.4 | 32.1 | 37.2 |
| S/N(c) | 0.0 | 0.0 | 0.0 |
| SN(E/C) |
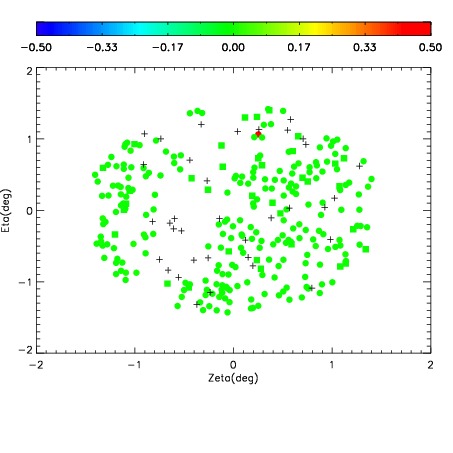

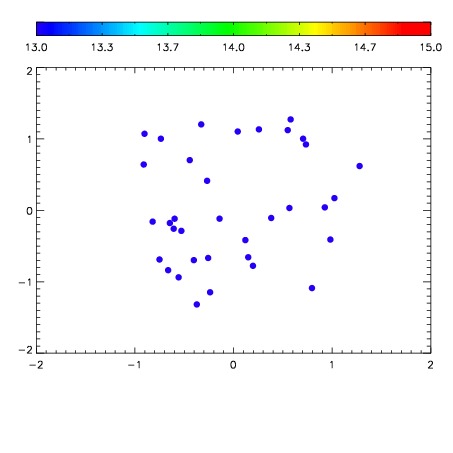

| Frame | Nreads | Zeropoints | Mag plots | Spatial mag deviation | Spatial sky 16325A emission deviations (filled: sky, open: star) | Spatial sky continuum emission | Spatial sky telluric CO2 absorption deviations (filled: H < 10) | |||||||||||||||||||||||
| 0 | 0 |
|
|
|
|
|
|
| IPAIR | NAME | SHIFT | NEWSHIFT | S/N | NAME | SHIFT | NEWSHIFT | S/N |
| 0 | 07040061 | 0.467956 | 0.00000 | 155.471 | 07040067 | -0.00535859 | 0.473315 | 141.349 |
| 1 | 07040060 | 0.467113 | 0.000843018 | 168.294 | 07040059 | 0.00000 | 0.467956 | 155.456 |
| 2 | 07040064 | 0.467508 | 0.000448018 | 141.473 | 07040066 | -0.00374635 | 0.471702 | 137.211 |
| 3 | 07040068 | 0.466575 | 0.00138101 | 137.799 | 07040063 | -0.00372511 | 0.471681 | 134.388 |
| 4 | 07040065 | 0.467778 | 0.000178009 | 136.700 | 07040062 | -0.00364119 | 0.471597 | 131.537 |