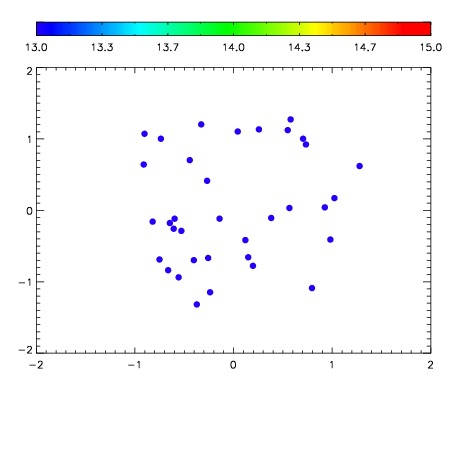
| Frame | Nreads | Zeropoints | Mag plots
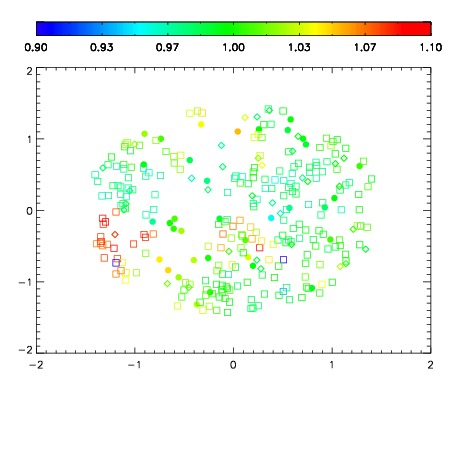
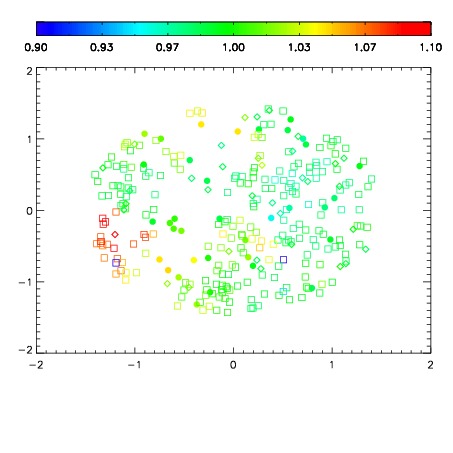
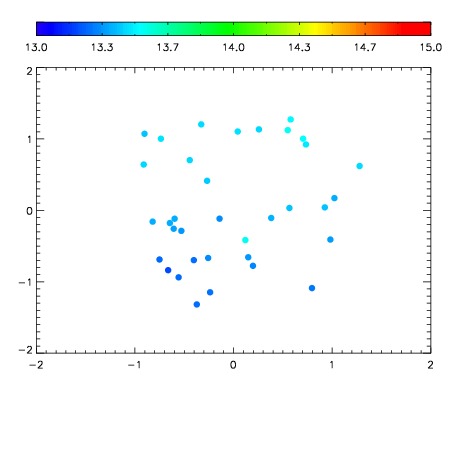
| Spatial mag deviation
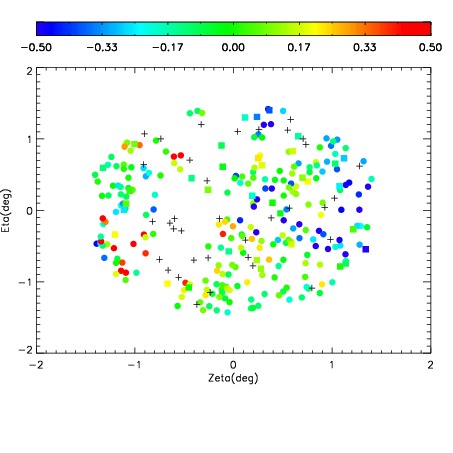
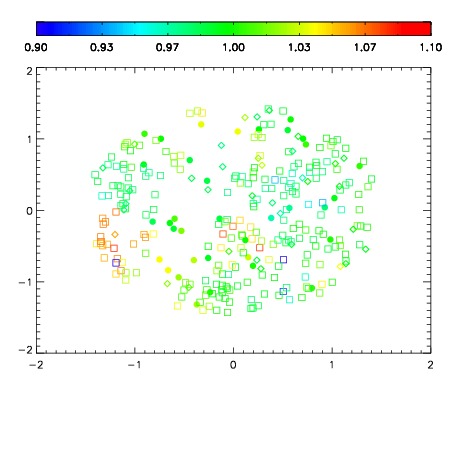
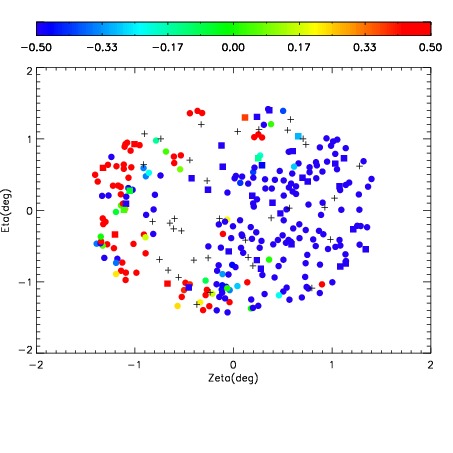
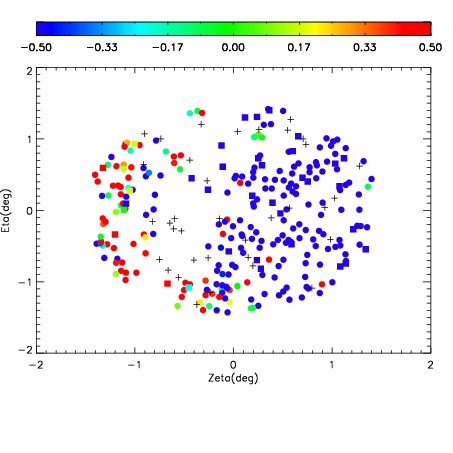
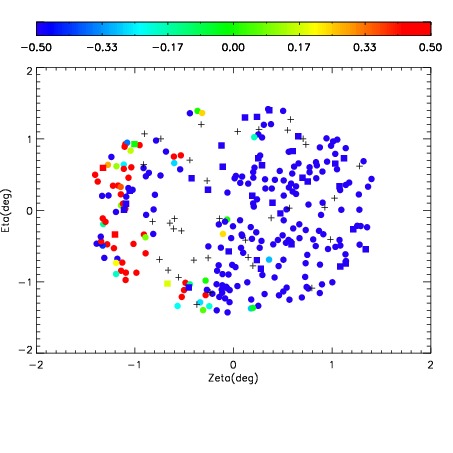
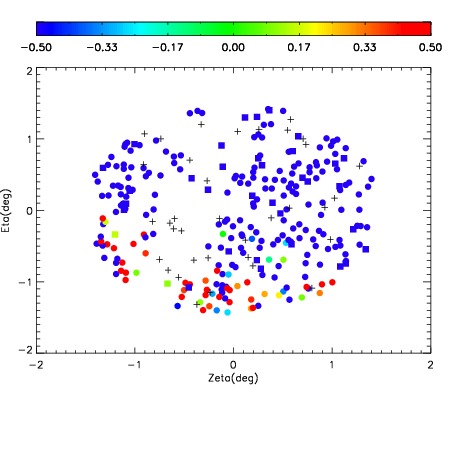
| Spatial sky 16325A emission deviations (filled: sky, open: star)
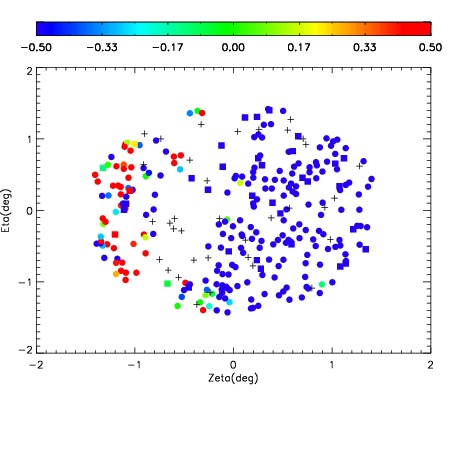
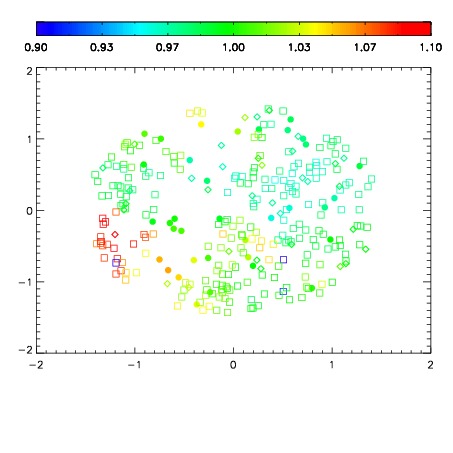
| Spatial sky continuum emission
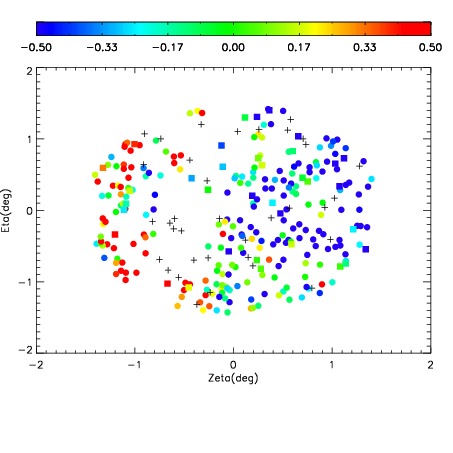
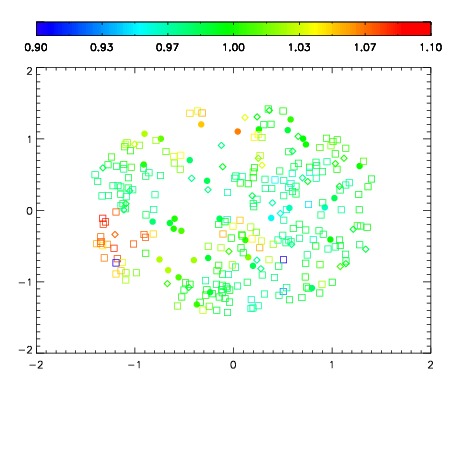
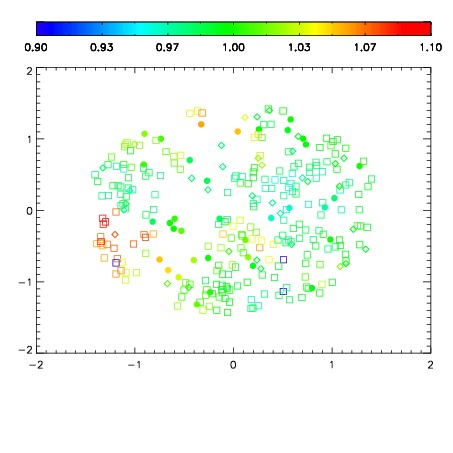
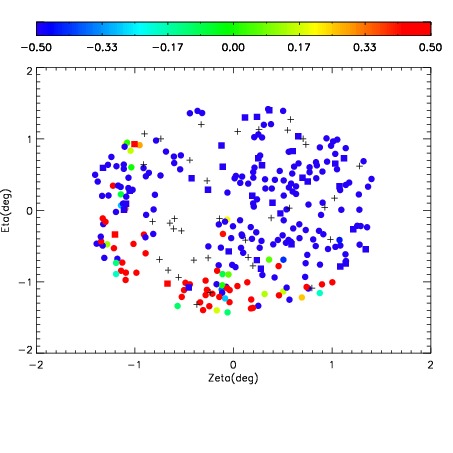
| Spatial sky telluric CO2 absorption deviations (filled: H < 10)
|
| 7260086
| 47
| | Red | Green | Blue
| | z | | 15.72
| | znorm | | 11.54
| | sky | 12.7 | 12.6 | 12.6
| | S/N | 0.9 | 1.4 | 4.0
| | S/N(c) | 0.9 | 1.3 | 3.1
| | SN(E/C) 0.97
|
| 
| 
| 
| 
| 
|
| 7260087
| 47
| | Red | Green | Blue
| | z | | 14.01
| | znorm | | 9.83
| | sky | 12.5 | 12.4 | 12.5
| | S/N | 0.1 | 0.2 | 2.1
| | S/N(c) | 0.2 | 0.2 | 1.9
| | SN(E/C) 0.96
|
| 
| 
| 
| 
| 
|
| 7260088
| 47
| | Red | Green | Blue
| | z | | 12.83
| | znorm | | 8.65
| | sky | 12.5 | 12.4 | 12.5
| | S/N | 0.0 | 0.2 | 1.8
| | S/N(c) | 0.0 | 0.0 | 0.0
| | SN(E/C)16.72
|
| 
| 
| 
| 
| 
|
| 7260089
| 47
| | Red | Green | Blue
| | z | | 12.87
| | znorm | | 8.69
| | sky | 12.5 | 12.4 | 12.5
| | S/N | 0.1 | 0.2 | 1.8
| | S/N(c) | 0.0 | 0.0 | 0.0
| | SN(E/C)10.76
|
| 
| 
| 
| 
| 
|
| 7260090
| 47
| | Red | Green | Blue
| | z | | 12.77
| | znorm | | 8.59
| | sky | 12.6 | 12.5 | 12.6
| | S/N | 0.1 | 0.1 | 1.5
| | S/N(c) | 0.0 | 0.0 | 0.0
| | SN(E/C)*****
|
| 
| 
| 
| 
| 
|
| 7260091
| 47
| | Red | Green | Blue
| | z | | 12.93
| | znorm | | 8.75
| | sky | 12.6 | 12.5 | 12.6
| | S/N | 0.0 | 0.1 | 1.4
| | S/N(c) | 0.0 | 0.0 | 0.0
| | SN(E/C)11.81
|
| 
| 
| 
| 
| 
|
| 7260092
| 47
| | Red | Green | Blue
| | z | | 13.38
| | znorm | | 9.20
| | sky | 13.0 | 12.9 | 13.0
| | S/N | 0.1 | 0.2 | 2.3
| | S/N(c) | 0.0 | 0.0 | 0.0
| | SN(E/C)-9.35
|
| 
| 
| 
| 
| 
|
| 7260093
| 47
| | Red | Green | Blue
| | z | | 13.78
| | znorm | | 9.60
| | sky | 13.6 | 13.4 | 13.4
| | S/N | 0.1 | -0.0 | 2.7
| | S/N(c) | 0.0 | 0.0 | 0.0
| | SN(E/C)-6.16
|
| 
| 
| 
| 
| 
|