| Red | Green | Blue | |
| z | 17.64 | ||
| znorm | Inf | ||
| sky | -Inf | -Inf | -Inf |
| S/N | 21.8 | 39.1 | 44.0 |
| S/N(c) | 0.0 | 0.0 | 0.0 |
| SN(E/C) |
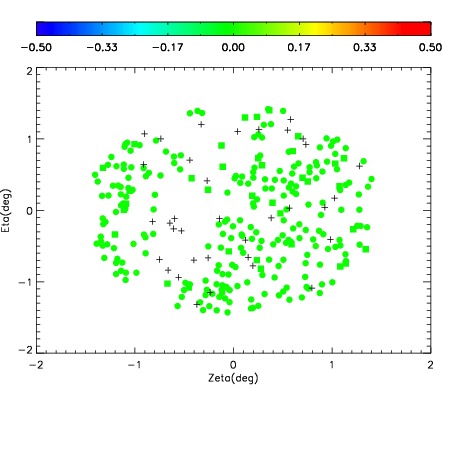
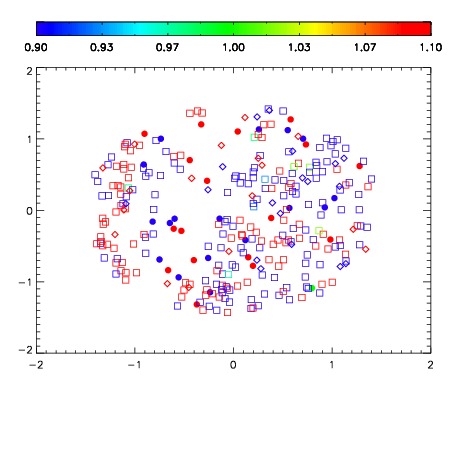
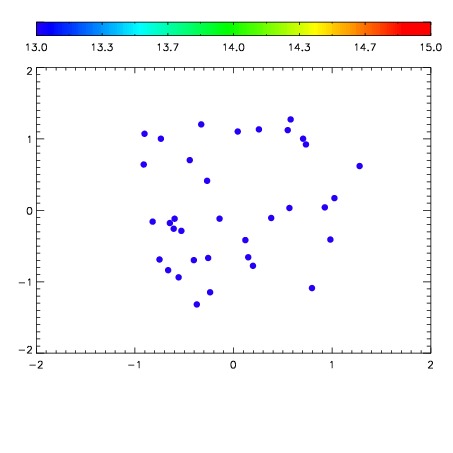

| Frame | Nreads | Zeropoints | Mag plots | Spatial mag deviation | Spatial sky 16325A emission deviations (filled: sky, open: star) | Spatial sky continuum emission | Spatial sky telluric CO2 absorption deviations (filled: H < 10) | |||||||||||||||||||||||
| 0 | 0 |
|
|
|
|
|
|
| IPAIR | NAME | SHIFT | NEWSHIFT | S/N | NAME | SHIFT | NEWSHIFT | S/N |
| 0 | 07850054 | 0.475151 | 0.00000 | 179.331 | 07850048 | 0.00000 | 0.475151 | 177.170 |
| 1 | 07850053 | 0.473103 | 0.00204802 | 185.777 | 07850051 | 0.00119713 | 0.473954 | 184.716 |
| 2 | 07850050 | 0.474075 | 0.00107601 | 182.029 | 07850052 | -0.00156657 | 0.476718 | 179.311 |
| 3 | 07850049 | 0.473451 | 0.00170001 | 176.725 | 07850055 | 0.000723738 | 0.474427 | 170.466 |